Key points:
-
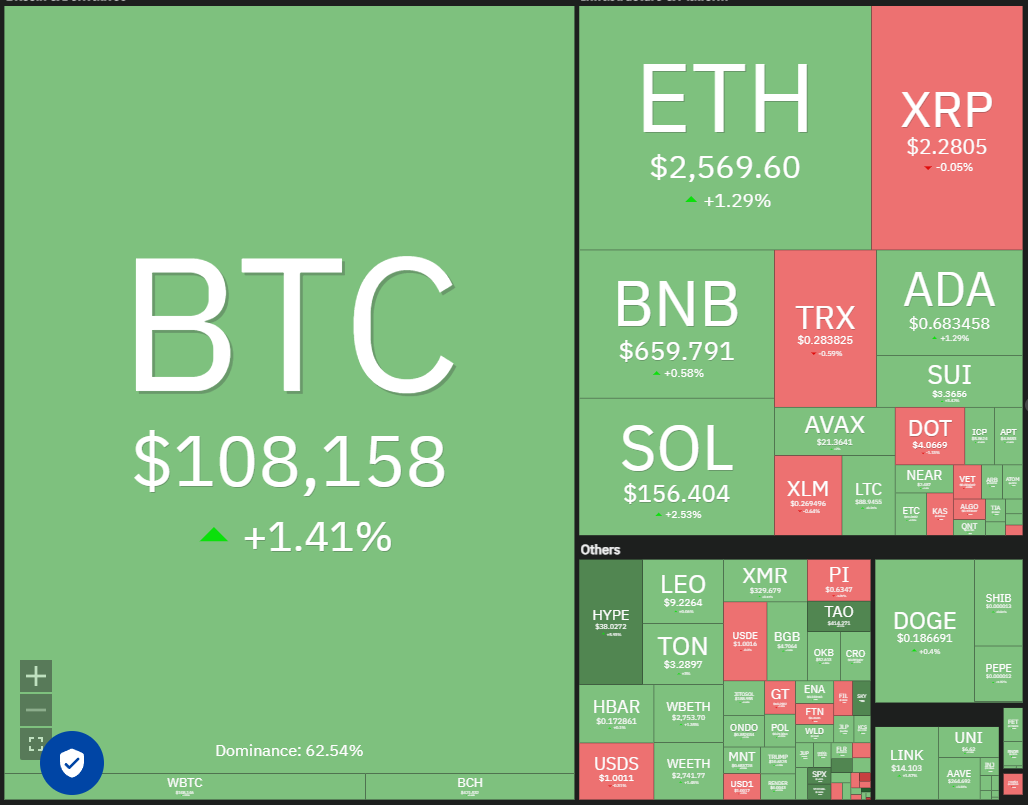
Bitcoin kicked off the week strongly as bulls aim for new peaks in BTC and altcoins.
-
Many significant altcoins remain range-bound, but HYPE is demonstrating signs of strength.
Bitcoin (BTC) started the week with momentum, moving towards the resistance zone of $109,588 to $111,980, possibly fueled by positive sentiment surrounding US-China trade discussions in London.
Trader Cas Abbe suggested in a post on X that Bitcoin might experience a significant price movement, potentially exceeding $109,000 to $110,000. He noted that $15.11 billion in shorts could be liquidated if Bitcoin rises 10% from current levels, while a 10% decline might result in $9.58 billion in long positions being liquidated.
While many analysts foresee an upward trajectory for Bitcoin in the long run, some predict a short-term dip before a resurgence. Private wealth manager Swissblock estimates a pullback to $104,000, while analyst Mickybull Crypto anticipates a drop to $101,500.
Will buyers push Bitcoin beyond the all-time high of $111,980, lifting altcoins in the process? Let’s analyze the charts of the top 10 cryptocurrencies to find out.
S&P 500 Index Price Prediction
The S&P 500 Index (SPX) continued its recovery last week, with bulls attempting to build on the momentum from June 9.
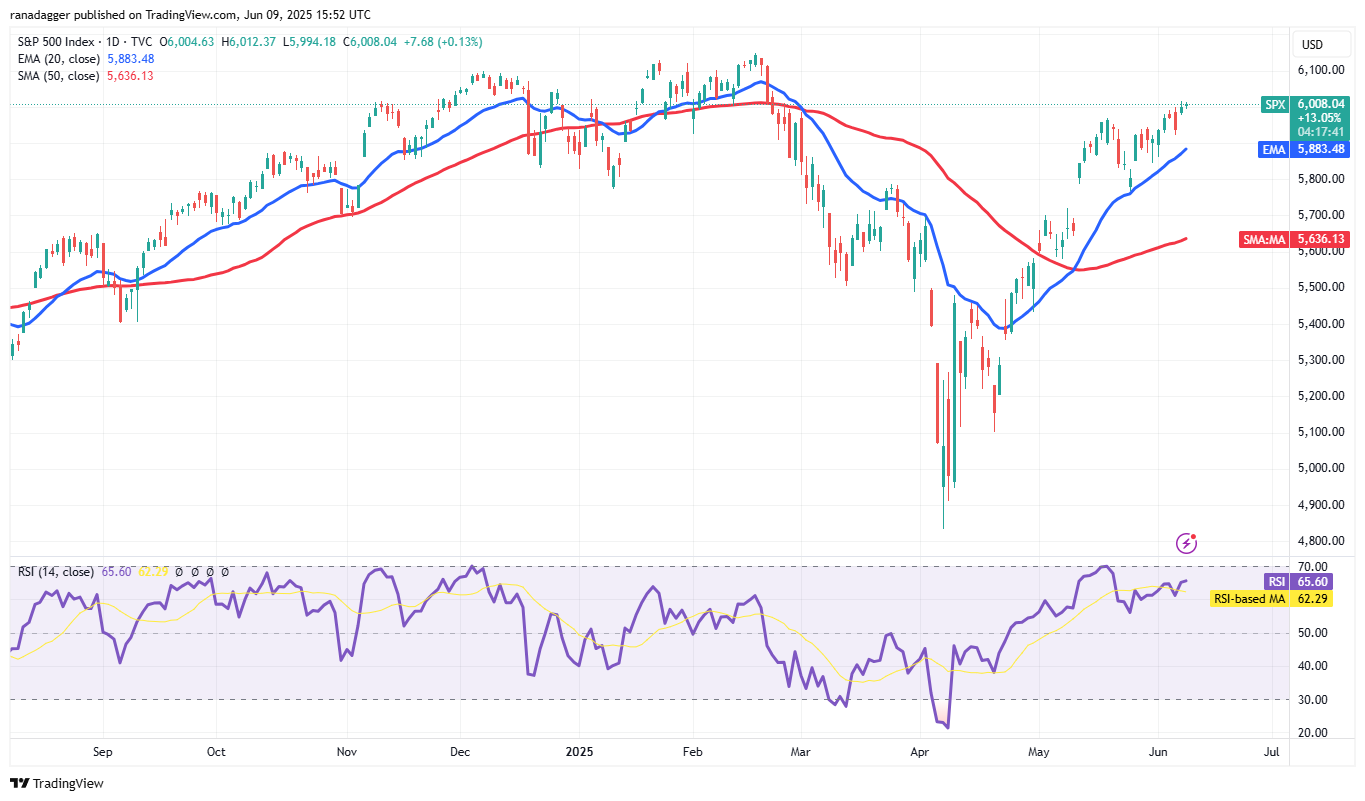
The upward-moving 20-day exponential moving average (EMA) (5,883) along with the positive relative strength index (RSI) indicate that bulls are in control. Buyers are aiming to drive the price toward the 6,147 overhead resistance.
The path upward may face challenges as sellers are expected to fiercely defend the 6,000 to 6,147 range. A break and close below the 20-day EMA would signal weakness, potentially leading to a drop to 5,767.
US Dollar Index Price Prediction
Buyers of the US Dollar Index (DXY) are attempting a recovery but are encountering resistance near the 20-day EMA (99.49).
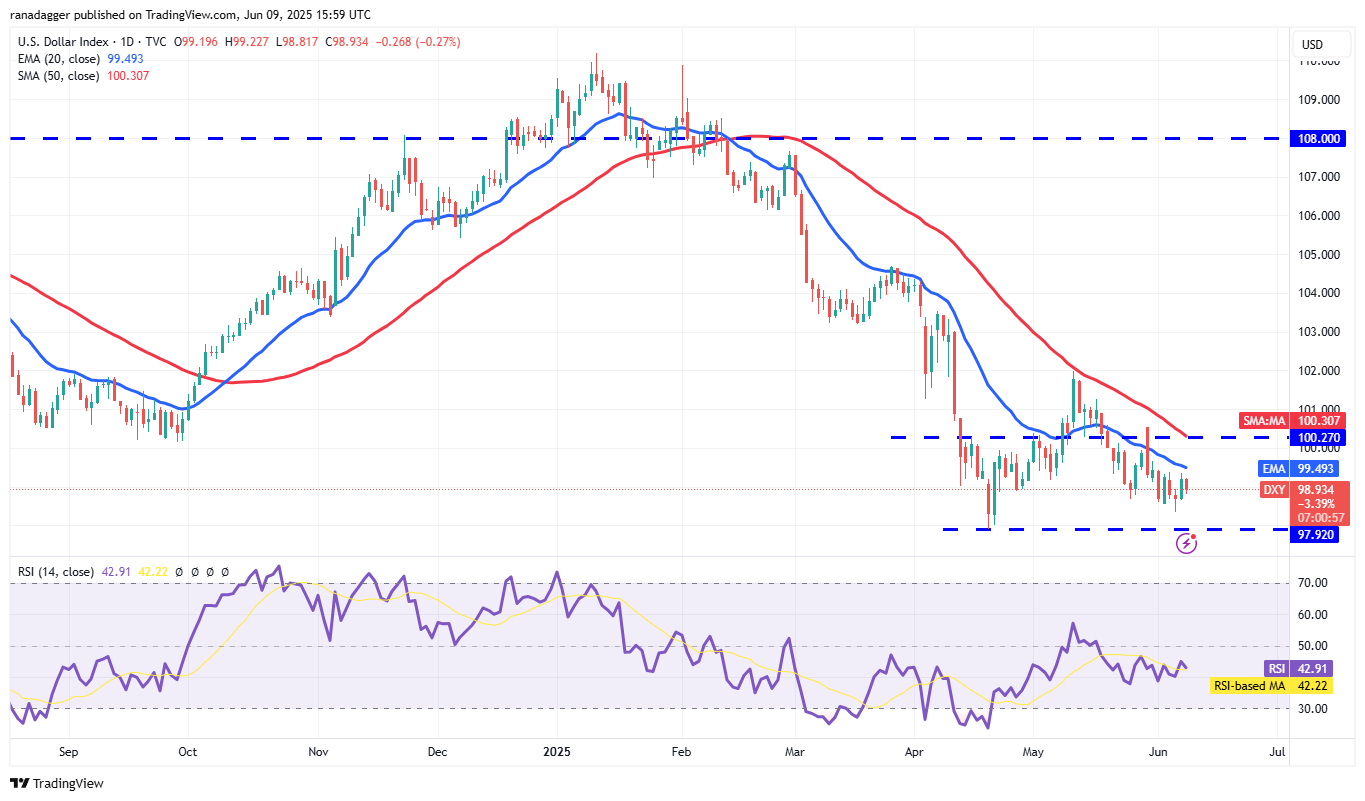
Bears are likely to push the index down to 97.92, a critical support level. A break and close below this point would suggest a continuation of the downtrend, potentially extending to 95.67.
This bearish outlook would become invalid if the price rises above the 50-day simple moving average (SMA) (100.30), which could propel the index to the resistance at 102.
Bitcoin Price Prediction
On June 7, Bitcoin climbed above the 20-day EMA ($105,296) and surpassed the overhead barrier at $106,794 on June 9.
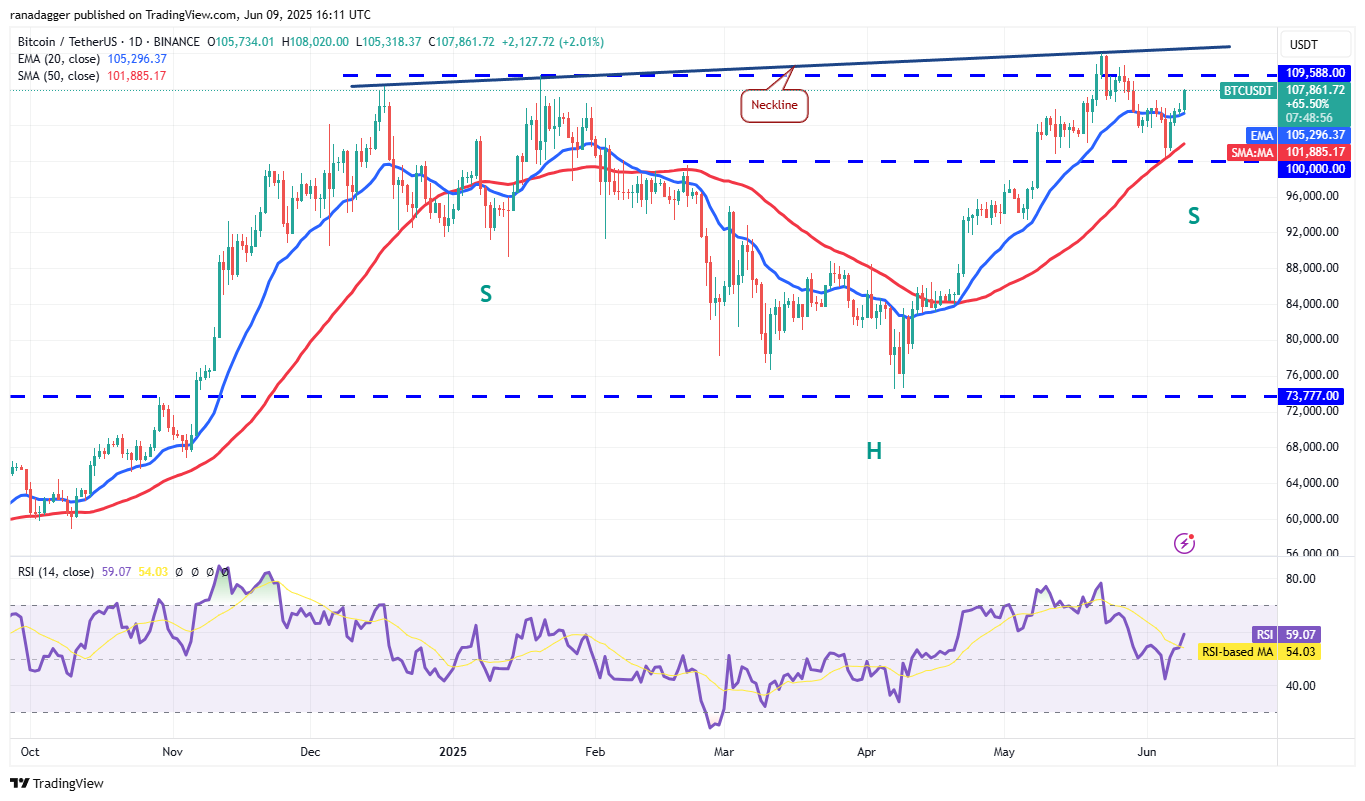
The recent price movement has formed an inverted head-and-shoulders pattern, which will complete with a break and close above the neckline near $112,700. If achieved, the pair could surge toward a target of $146,892.
Conversely, a downturn breaking below the 20-day EMA would indicate that bears are reasserting control. In such a case, the BTC/USDT pair could drop to key support at $100,000. Buyers are anticipated to defend this level vigorously, as a breach could lead to a deeper pullback to $93,000.
Ether Price Prediction
Ether (ETH) has been consolidating between $2,323 and $2,738 in recent days, showcasing a competitive struggle between bulls and bears.
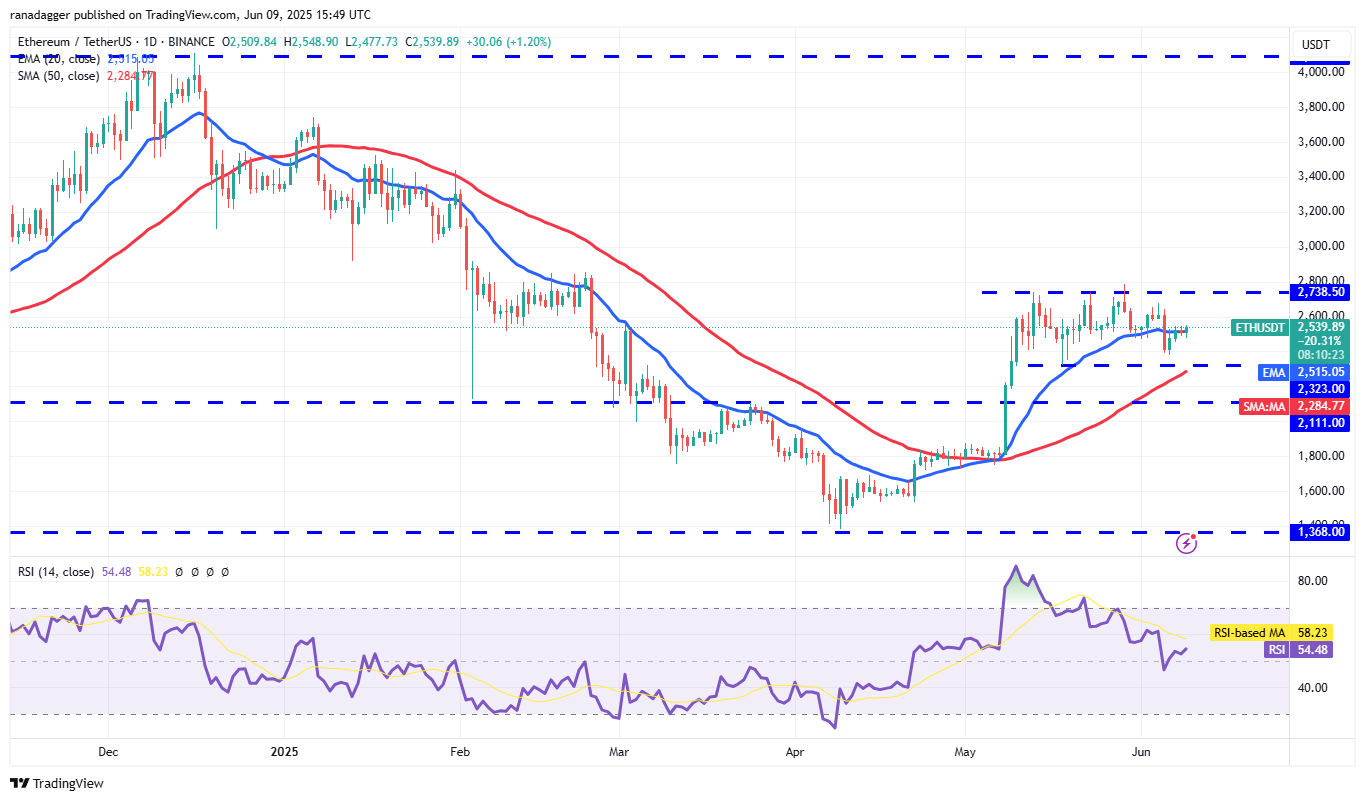
If the price stays above the 20-day EMA ($2,515), the ETH/USDT pair may rally to $2,738, a critical resistance point for bears to defend. If surpassed, the pair could ascend to $3,000 and then $3,153.
On the other hand, a sharp decline from the current levels would indicate bearish control. The trend would favor bears if the price breaks below the 50-day SMA ($2,284), possibly leading to a fall to $2,111.
XRP Price Prediction
XRP (XRP) has been trading in a range between $2 and $2.65 for several days, reflecting a balance of supply and demand.
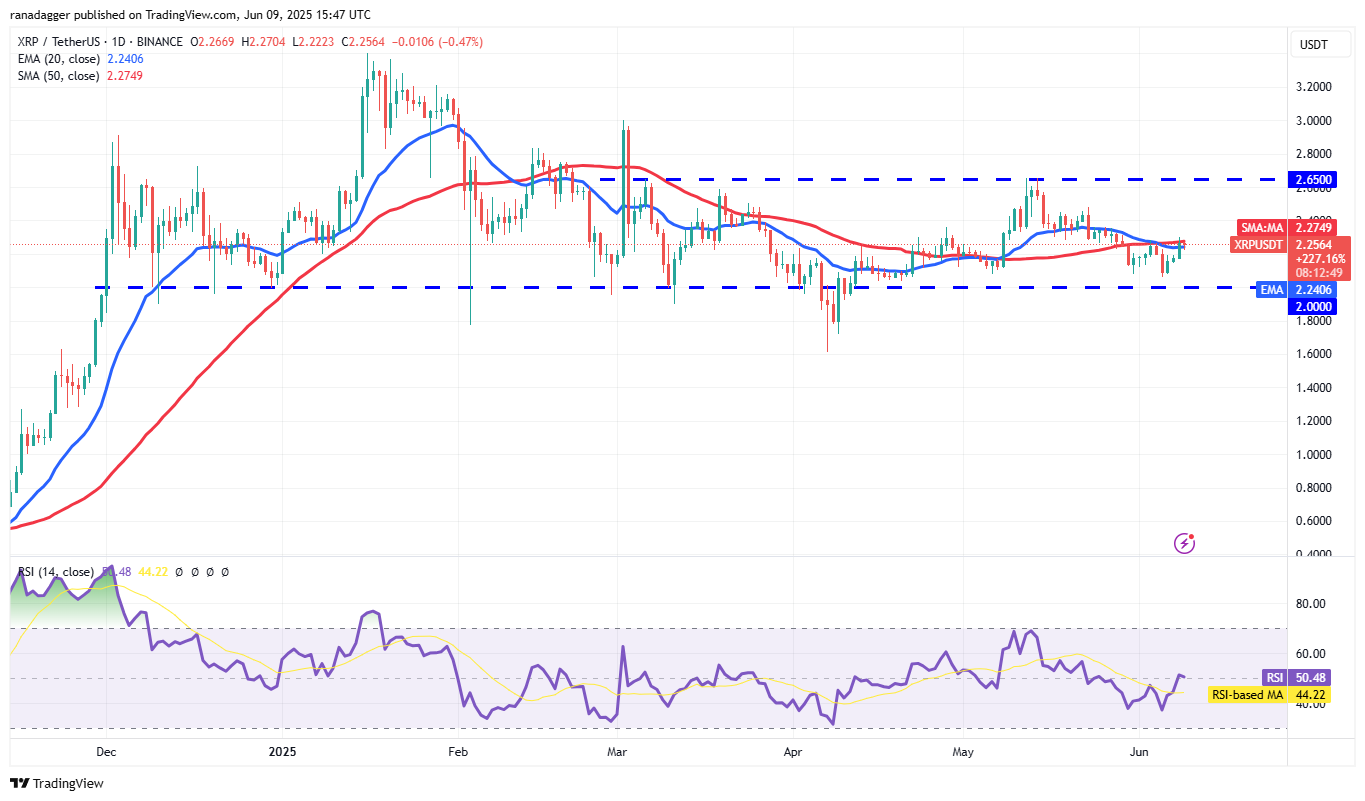
The flat moving averages and RSI around the midpoint suggest no clear advantage for either bulls or bears. If the price surpasses the moving averages, the XRP/USDT pair could rise to the $2.65 resistance.
If the price declines from the moving averages, bears will aim to drive it below the $2 support. A breach could lead to a retest of the vital support at $1.61.
BNB Price Prediction
BNB (BNB) has been fluctuating between $693 and $634 recently, indicating buying near support and selling near resistance.
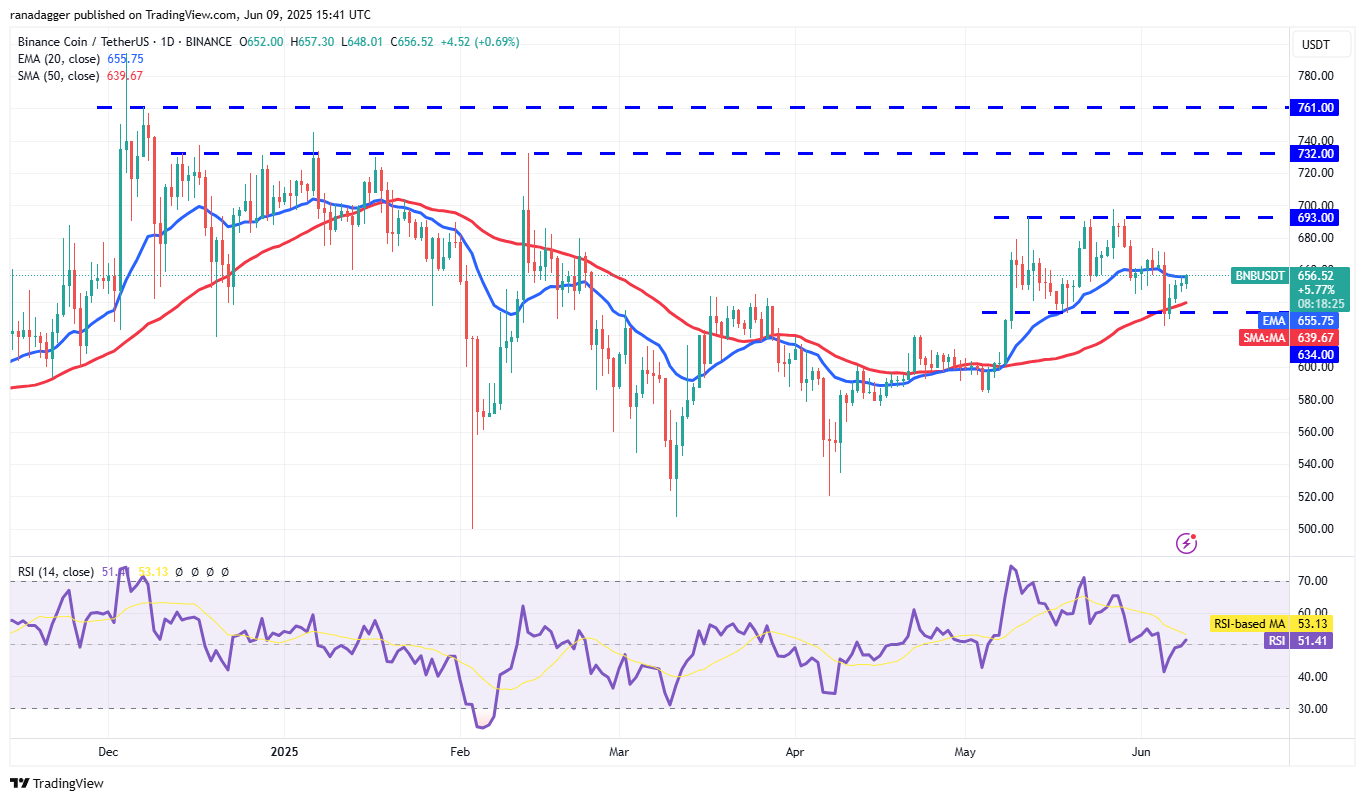
If buyers push the price above the 20-day EMA ($655), the BNB/USDT pair may continue trading within the range for a while longer. A significant uptrend could initiate once the price exceeds $693, potentially rallying to $732.
However, sellers may have different intentions. They will likely attempt to thwart the rally at the 20-day EMA. If they succeed, the pair could drop below the $634 support and potentially fall to $580.
Solana Price Prediction
Solana (SOL) rebounded from the $140 support on June 5, yet the recovery is expected to encounter resistance at the 20-day EMA ($158).
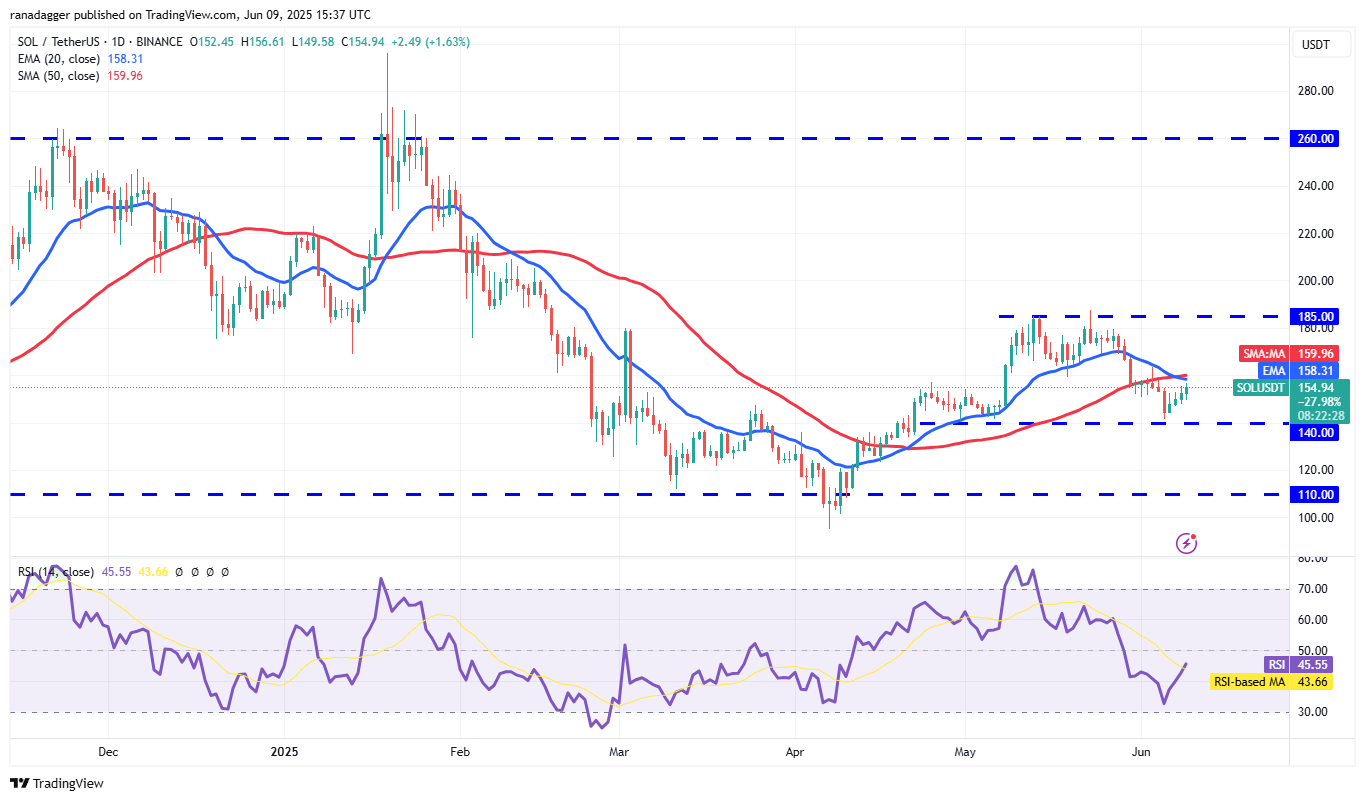
If the price declines from the moving averages, bears will attempt to pull the SOL/USDT pair below $140. If they succeed, the pair may fall to $123 and later to strong support at $110.
Conversely, if the price breaks above the moving averages, it would indicate loss of bearish control. The pair could then strive for a rally to $185, where sellers are expected to present significant resistance.
Related: XRP price may reach $25 if ETF is approved, followed by a 90% decline, new analysis suggests
Dogecoin Price Prediction
Dogecoin (DOGE) is finding support near $0.16, but bulls are facing challenges in maintaining higher levels.
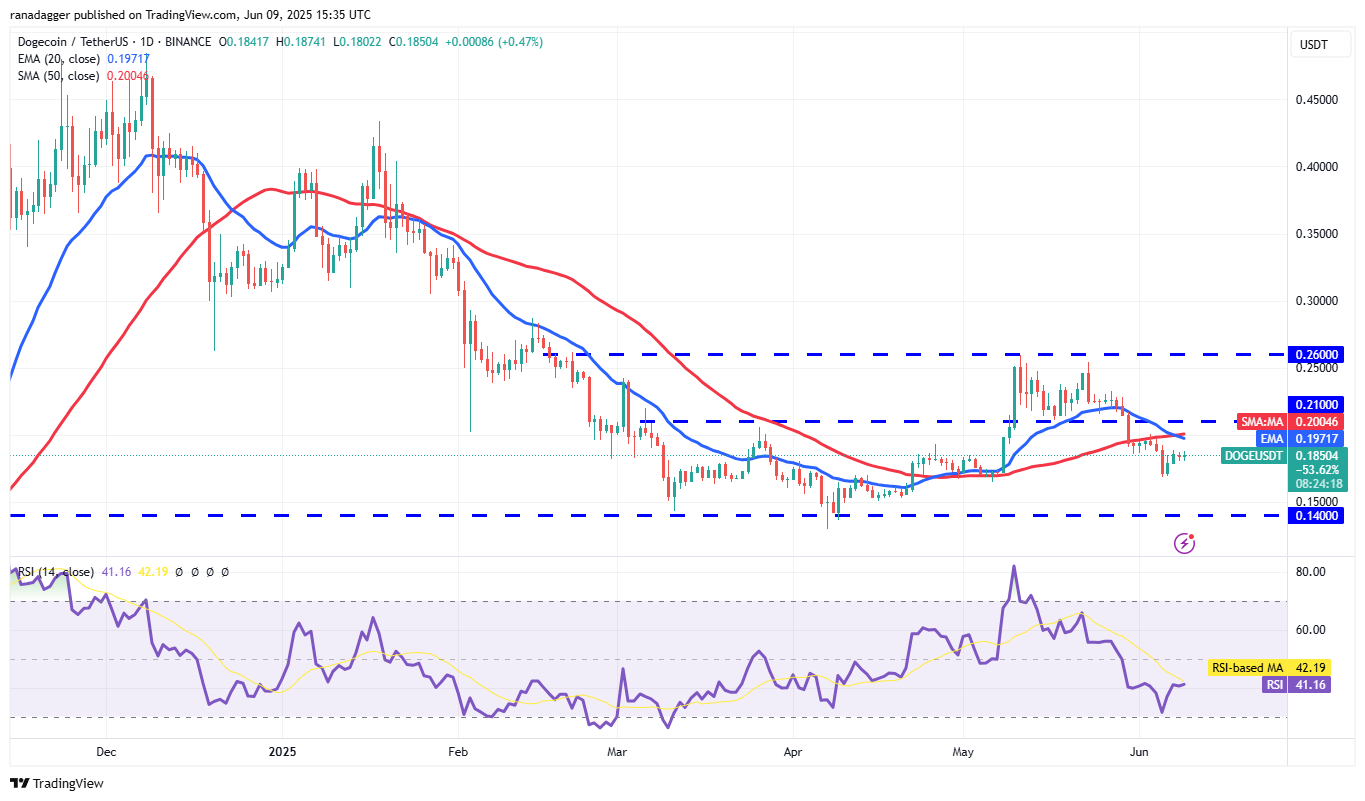
The declining 20-day EMA ($0.19) and negative RSI suggest that bears have an advantage. Sellers will target a drop below $0.16, pressing on the critical $0.14 support level. Buyers are expected to defend the $0.14 mark strongly, keeping the DOGE/USDT pair within range for now.
The longer the price remains in this range, the greater the potential for a breakout. An upward movement could initiate if buyers push the pair above $0.26.
Cardano Price Prediction
Cardano’s (ADA) recovery is encountering resistance near the 20-day EMA ($0.69), indicating that bears are selling during rallies.
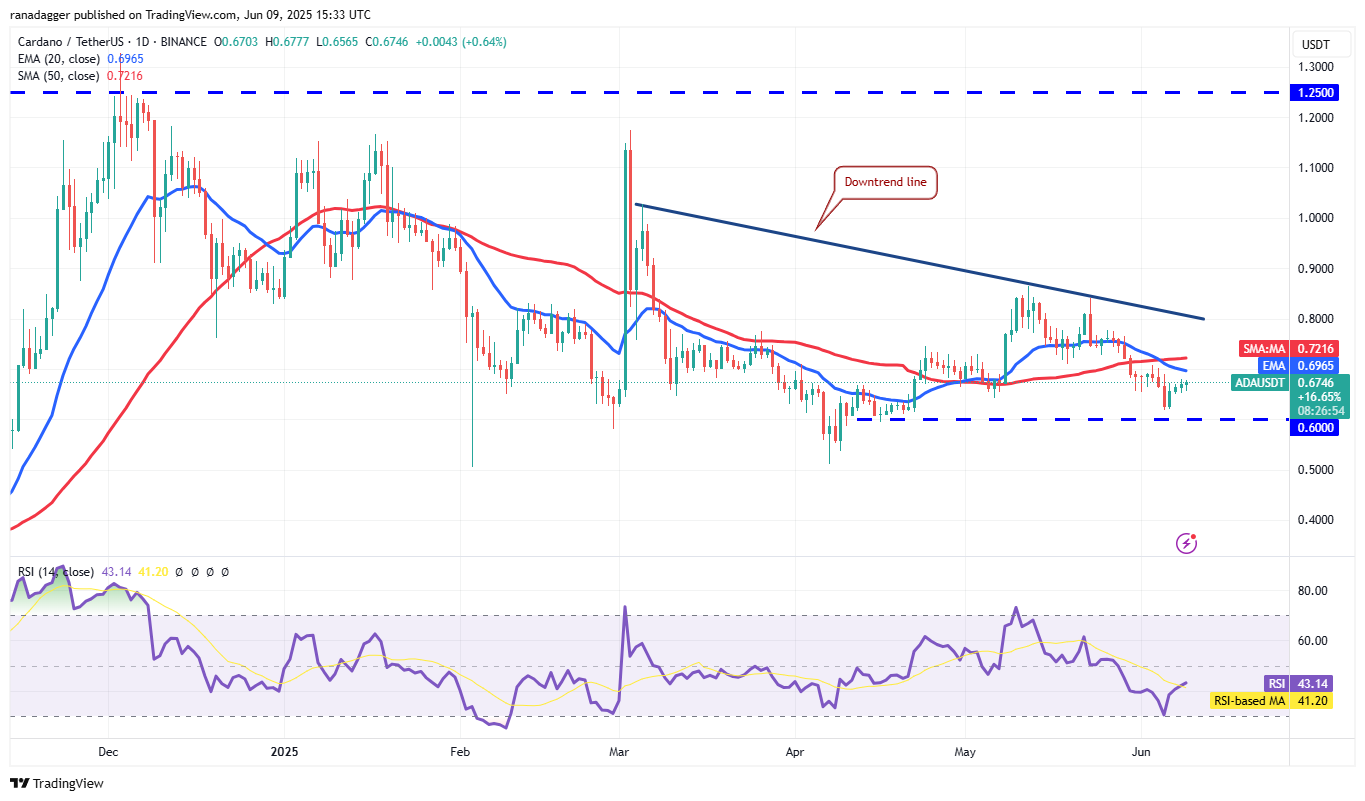
Bears will aim to pull the price below $0.60. If successful, the ADA/USDT pair may retest the $0.50 support. Buyers are likely to defend the $0.50 level vigorously, as a break below it could lead to a drop to $0.40.
For buyers to gain strength, they must push the price above the moving averages. The pair could then rise to the downtrend line, a key obstacle. A break and close above this line would indicate the beginning of a new upwards trend towards $1.02.
Hyperliquid Price Prediction
Hyperliquid (HYPE) surged above the symmetrical triangle pattern on June 9, suggesting a resolution of uncertainty in favor of buyers.
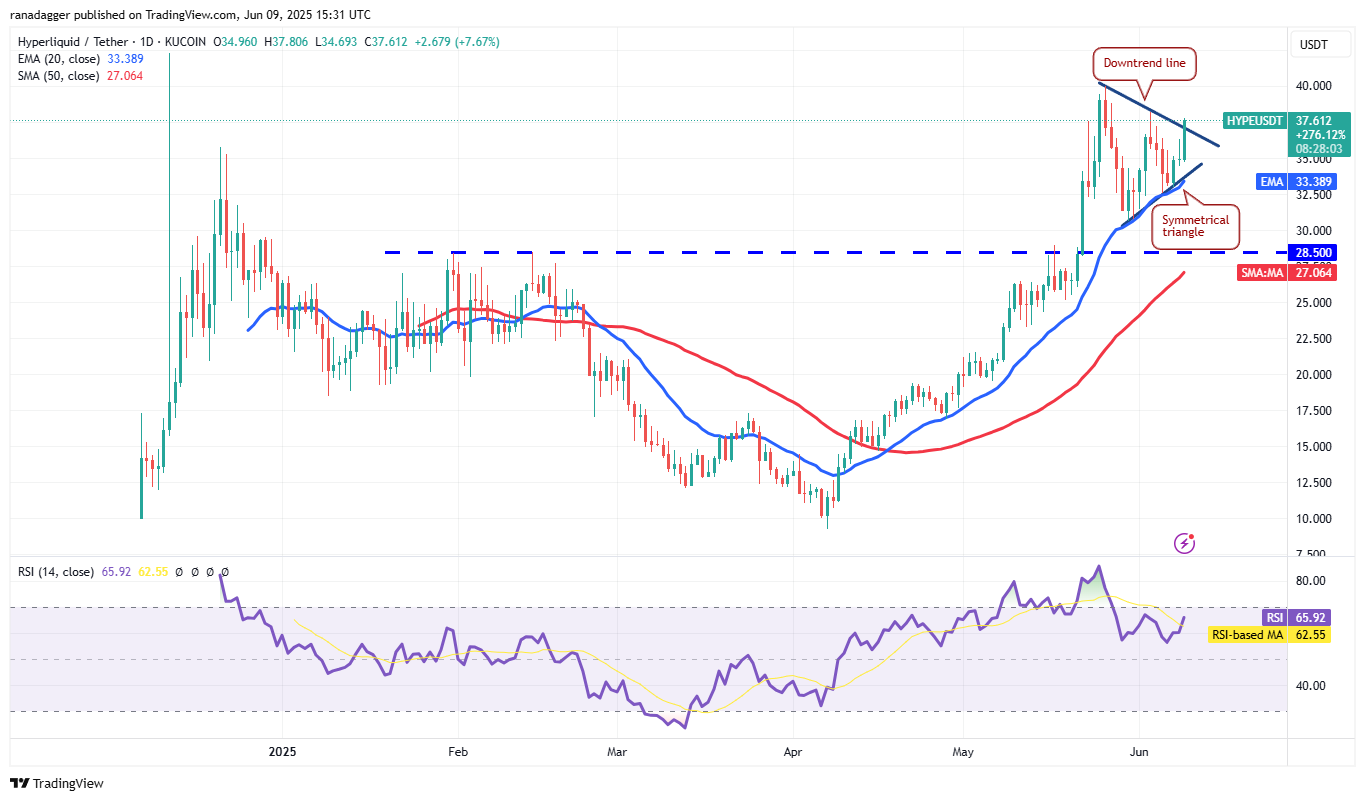
If buyers maintain the price above the triangle, the HYPE/USDT pair could gain momentum and rise to $42.50. Although there is resistance at $40, it is likely to be surpassed. If sellers attempt to halt the advance at $42.50 but fail, the pair could aim for the pattern target of $46.50.
This optimistic outlook would be negated if the price sharply declines and breaks below the triangle, indicating a potential bull trap. Under such circumstances, the pair could drop to $30.50 and subsequently to $28.50.
This article does not contain investment advice or recommendations. Every investment and trading move involves risk, and readers should conduct their own research when making a decision.