Key points:
-
Bitcoin remains within a range, with traders split on the likelihood of the next major movement.
-
Several prominent altcoins are displaying signs of weakness, hinting at a possible larger trend reversal.
Bitcoin’s (BTC) volatility increased on Friday, yet the price stayed within the substantial range of $100,000 to $111,980. Market participants are uncertain about the next breakout. A poll conducted by crypto analyst Matthew Hyland asked whether Bitcoin would reach $94,000 or $114,000, and the results were nearly evenly split.
Comments on social media regarding Bitcoin reflect a similar divide. According to crypto research platform Santiment, there were roughly 1.03 bullish comments for every bearish one. The firm highlighted that Bitcoin’s retail sentiment is more bearish than it has been since the initial tariff reactions on April 6.
Santiment’s marketing director, Brian Quinlivan, noted that this retail fear is encouraging because historically, markets tend to move in the opposite direction of retail expectations.
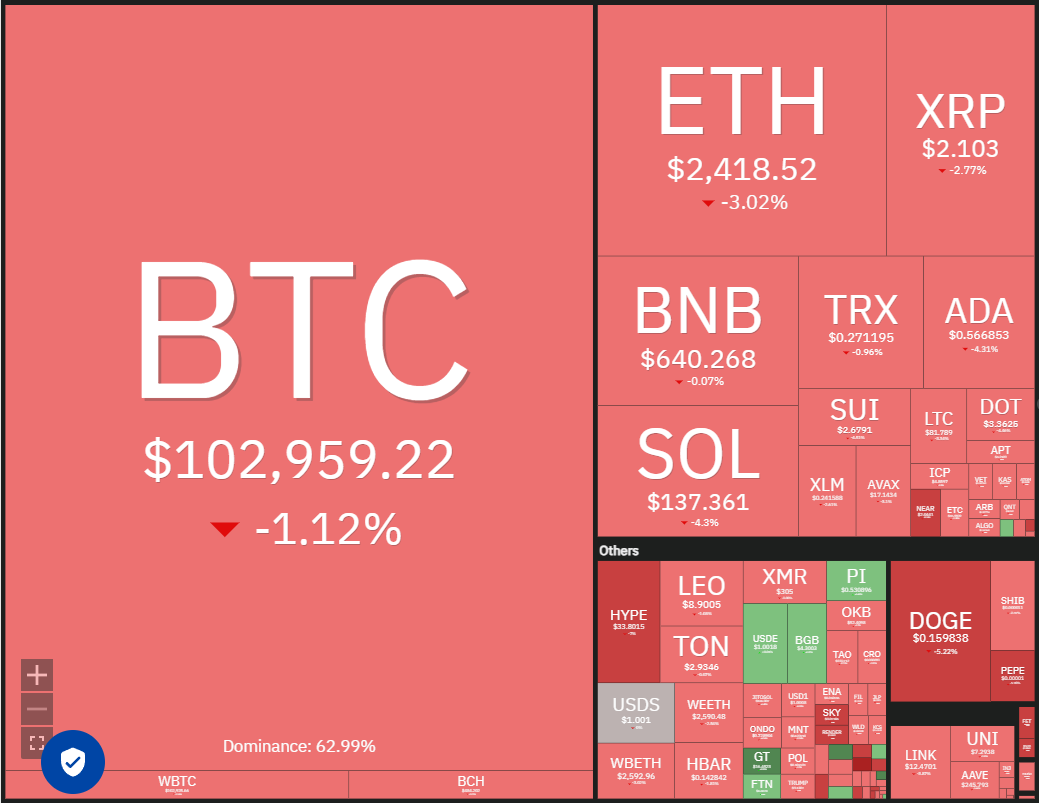
Institutional investor confidence remains robust, with US-based spot Bitcoin exchange-traded funds experiencing eight consecutive days of inflows, according to data from Farside Investors.
What key support and resistance levels should traders monitor for Bitcoin and the altcoins? Let’s analyze the charts of the top 10 cryptocurrencies for insights.
Bitcoin price prediction
Bitcoin bounced off the 50-day simple moving average ($104,634) on Friday and climbed above the 20-day exponential moving average ($105,590). However, the bulls were unable to maintain these higher levels, as indicated by the long wick on the candlestick.
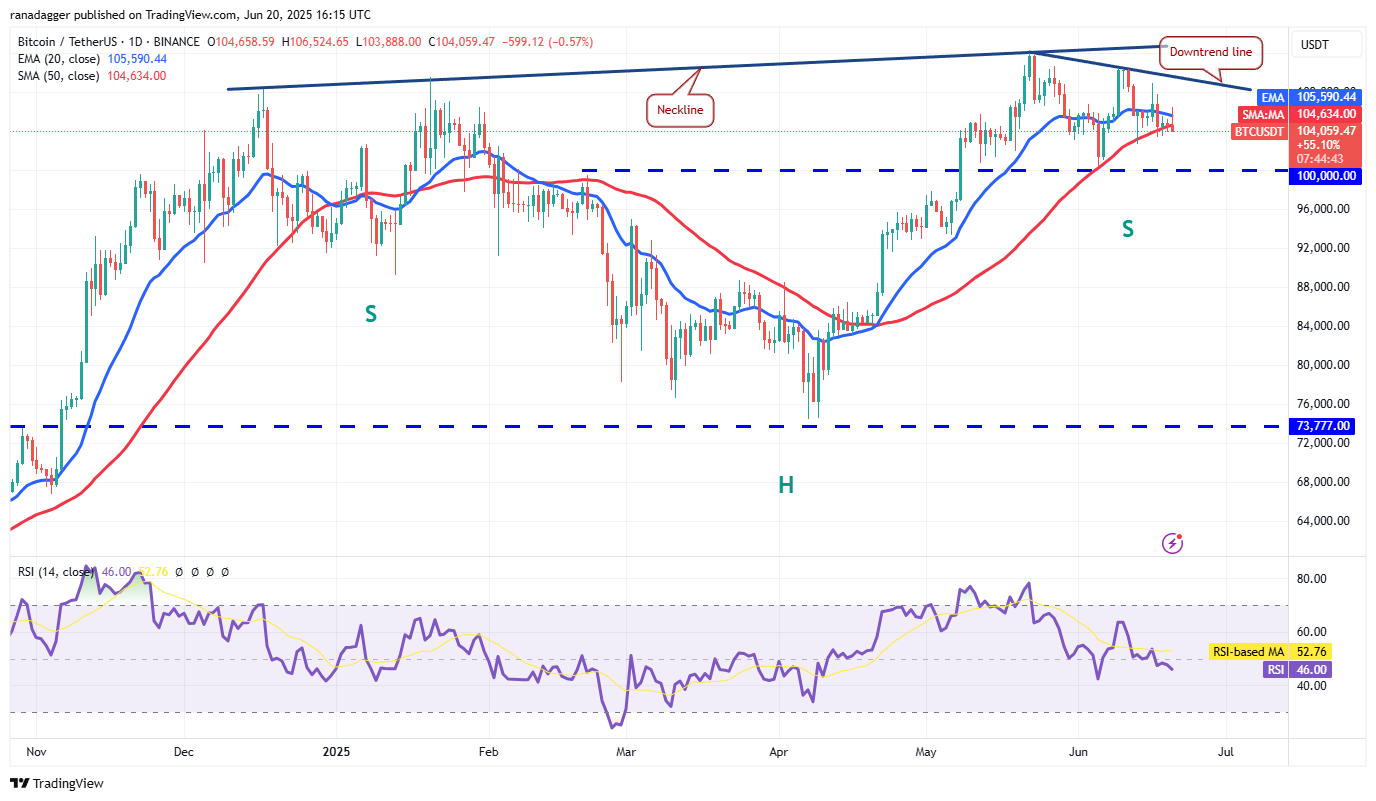
The bears will attempt to assert control by pushing the price below the 50-day SMA. If successful, the BTC/USDT pair may fall to the psychologically significant level of $100,000, which buyers are expected to defend aggressively. A failure to maintain this level might trigger a deeper correction toward $93,000.
On the upside, bulls need to keep the price above the 20-day EMA to indicate strength. If they succeed, the pair could rise toward the downtrend line. Sellers are likely to present a significant challenge between this downtrend line and the all-time high of $111,980.
Ether price prediction
Ether (ETH) is caught between the 20-day EMA ($2,551) and the 50-day SMA ($2,466), signifying uncertainty from both buyers and sellers.
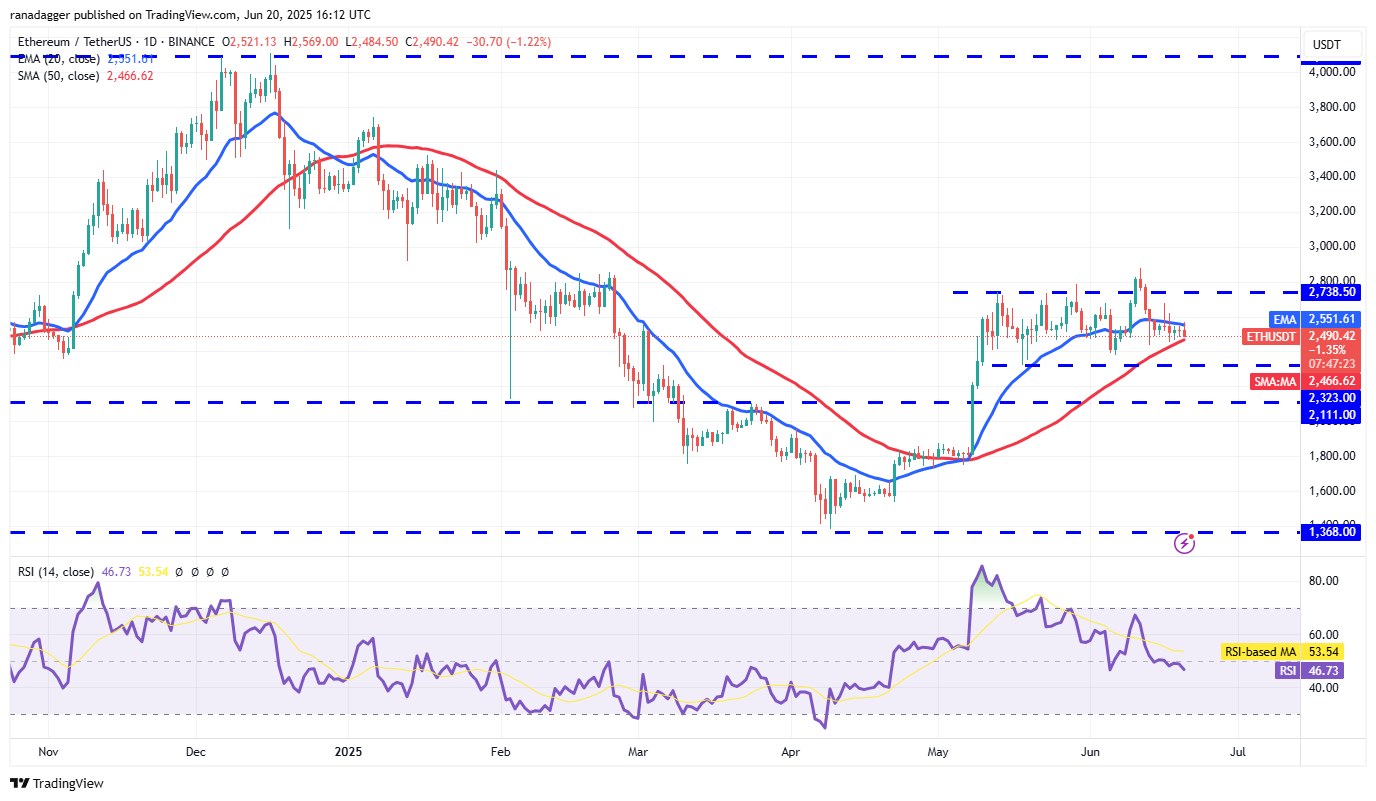
The flat 20-day EMA and the RSI near the midpoint offer no clear edge to either the bulls or bears. A break above the 20-day EMA could see the ETH/USDT pair rise to $2,738 and eventually to $2,879.
Conversely, a drop below the 50-day SMA could lead to a fall to the key support at $2,323. Buyers are expected to defend this level vigorously, as a breach could drive the pair down to $2,111.
XRP price prediction
Buyers are trying to push XRP (XRP) above the 20-day SMA ($2.20), but bears remain resilient.
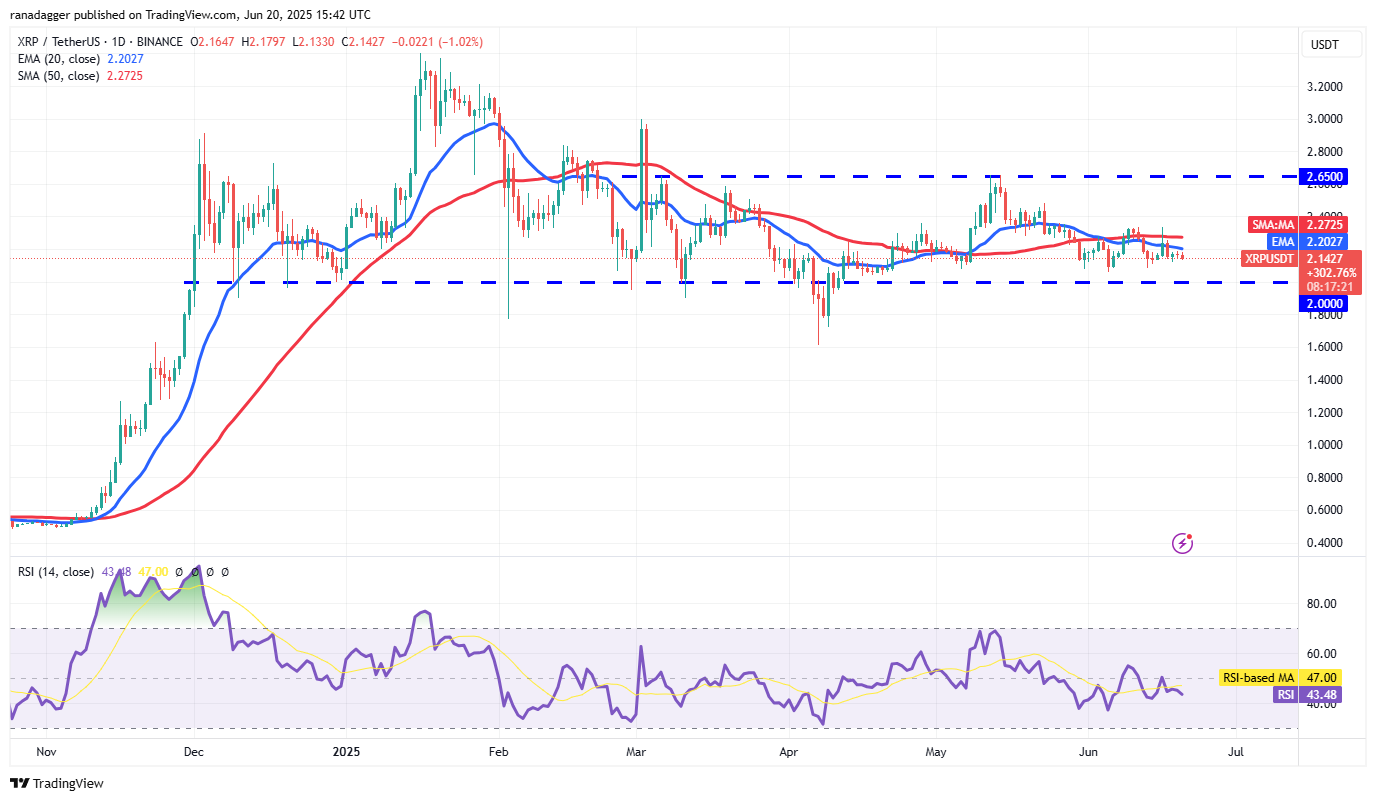
The 20-day EMA has started a gradual decline, and the RSI is in negative territory, indicating a slight advantage to the bears. The pair may drop to the crucial $2 support, which is essential to monitor. If this level is breached, the XRP/USDT pair could fall to $1.61.
If the price rebounds from the current level or off $2 and breaks above the 50-day SMA ($2.27), this would suggest the pair might remain within the range for a while longer.
BNB price prediction
BNB (BNB) is caught between the 20-day EMA ($652) and the horizontal support at $634, indicating a potential imminent breakout.
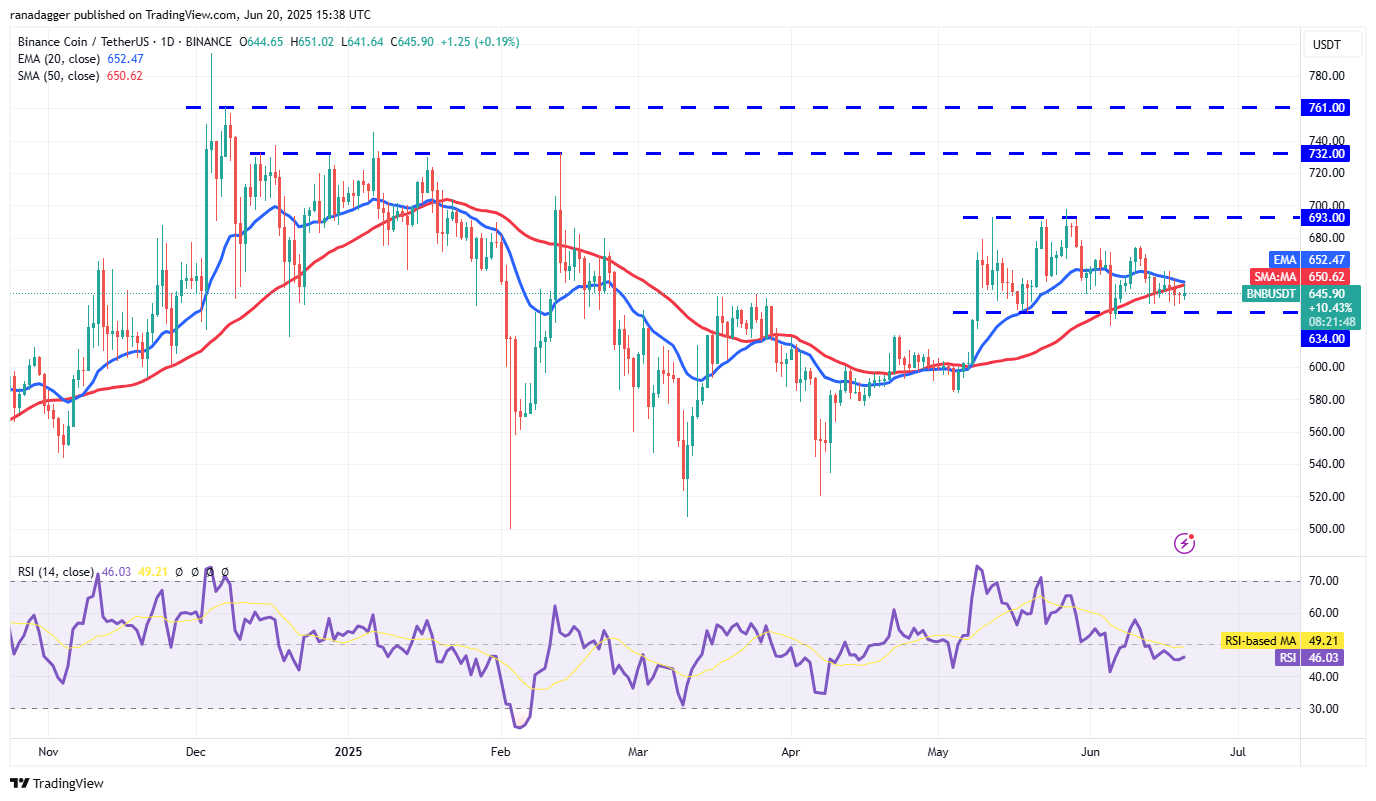
If the price rises and breaks above the 20-day EMA, it signals that the BNB/USDT pair might stay within the $634 to $693 range for a bit longer. A close above $693 would favor the bulls.
Conversely, a break and close below the $634 support would indicate that the range-bound action has shifted in favor of the bears, potentially accelerating selling and pulling the pair down to the solid support at $580.
Solana price prediction
Buyers have kept Solana (SOL) above the $140 support but are struggling to surpass the 20-day EMA ($152).
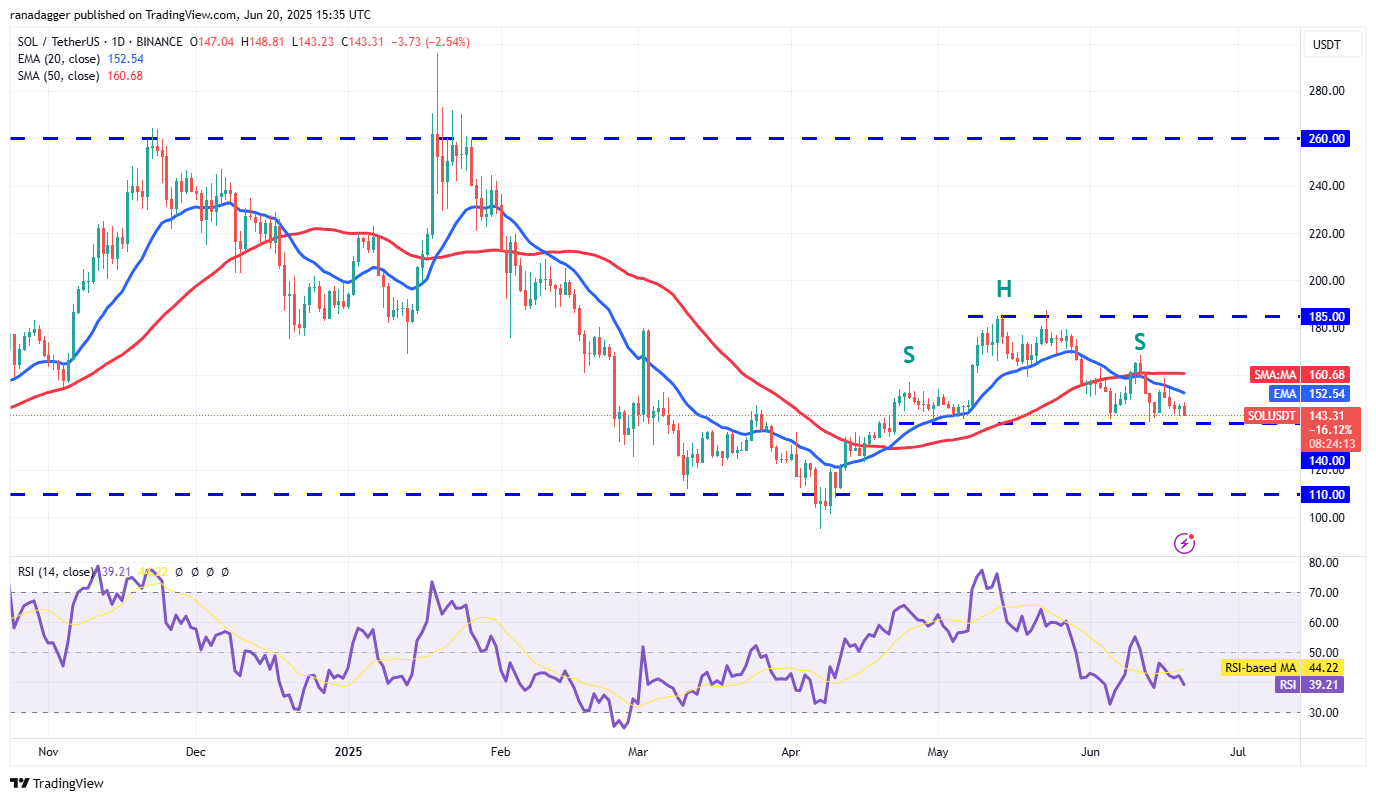
A tight consolidation near the $140 support heightens the risk of a breakdown. If this occurs, the SOL/USDT pair may develop a head-and-shoulders pattern, potentially leading to a drop to $123 and subsequently to $110.
Alternatively, if the price moves upward and breaks above the 20-day EMA, it suggests that bulls aim to keep the pair within the $140 to $185 range for a longer period. Buyers will regain control on a close above $185.
Dogecoin price prediction
Buyers have maintained Dogecoin (DOGE) above the $0.16 mark, but the lack of a strong rebound heightens the risk of a downturn.
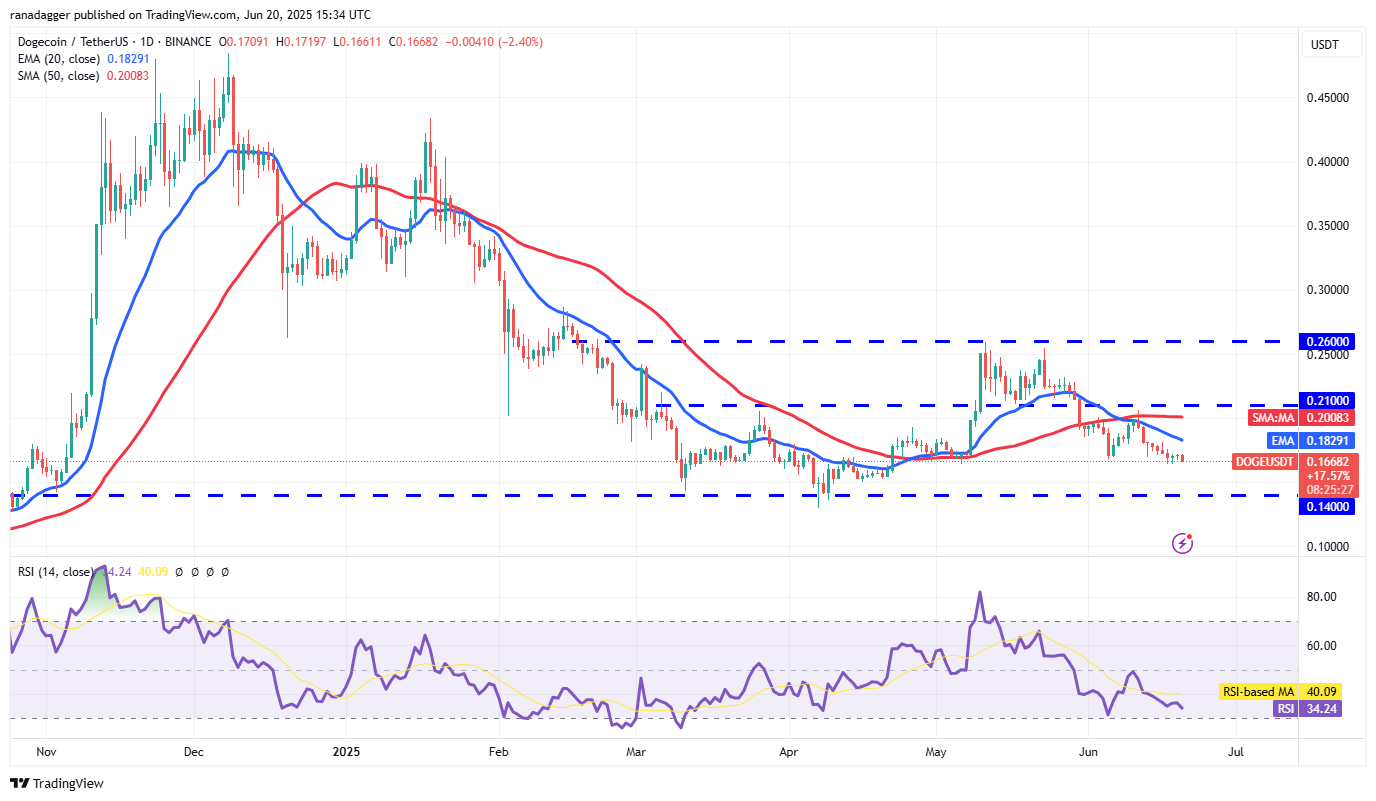
If the $0.16 support fails, the DOGE/USDT pair could drop to the critical support at $0.14. A significant rebound from the $0.14 level would indicate strong buying interest from bulls. Relief gains above the 20-day EMA could sustain the pair within the $0.14 to $0.26 range longer.
In contrast, if the price continues to decline and breaks below $0.14, it would signify that bears have taken control, potentially leading to a drop to $0.10.
Cardano price prediction
Cardano (ADA) is currently experiencing a fierce contest between bulls and bears near the $0.60 mark.
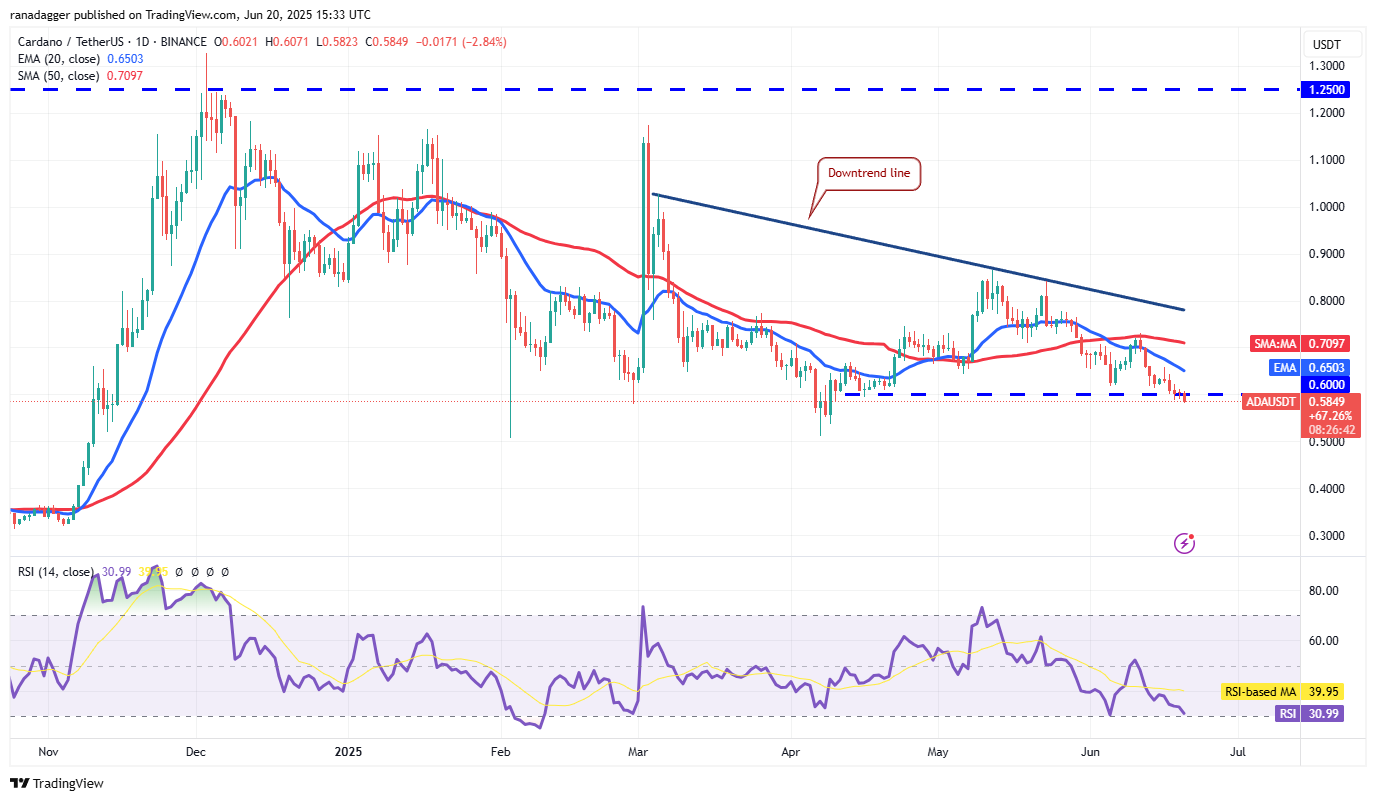
The descending 20-day EMA ($0.65) and the RSI approaching the oversold zone indicate an advantage for sellers. Should the price stay below $0.60, the ADA/USDT pair could drop to the critical support at $0.50, which buyers are expected to defend fiercely. A failure to maintain this level could lead the pair down to $0.40.
A break above the 20-day EMA would signal a show of strength, suggesting solid buying at lower levels, and could allow the pair to rise toward the downtrend line.
Related: XRP onchain data shows why $3 is out of reach for now
Hyperliquid price prediction
Hyperliquid (HYPE) declined and fell below the 20-day EMA ($37.61) on Thursday, indicating profit-taking by short-term bulls.
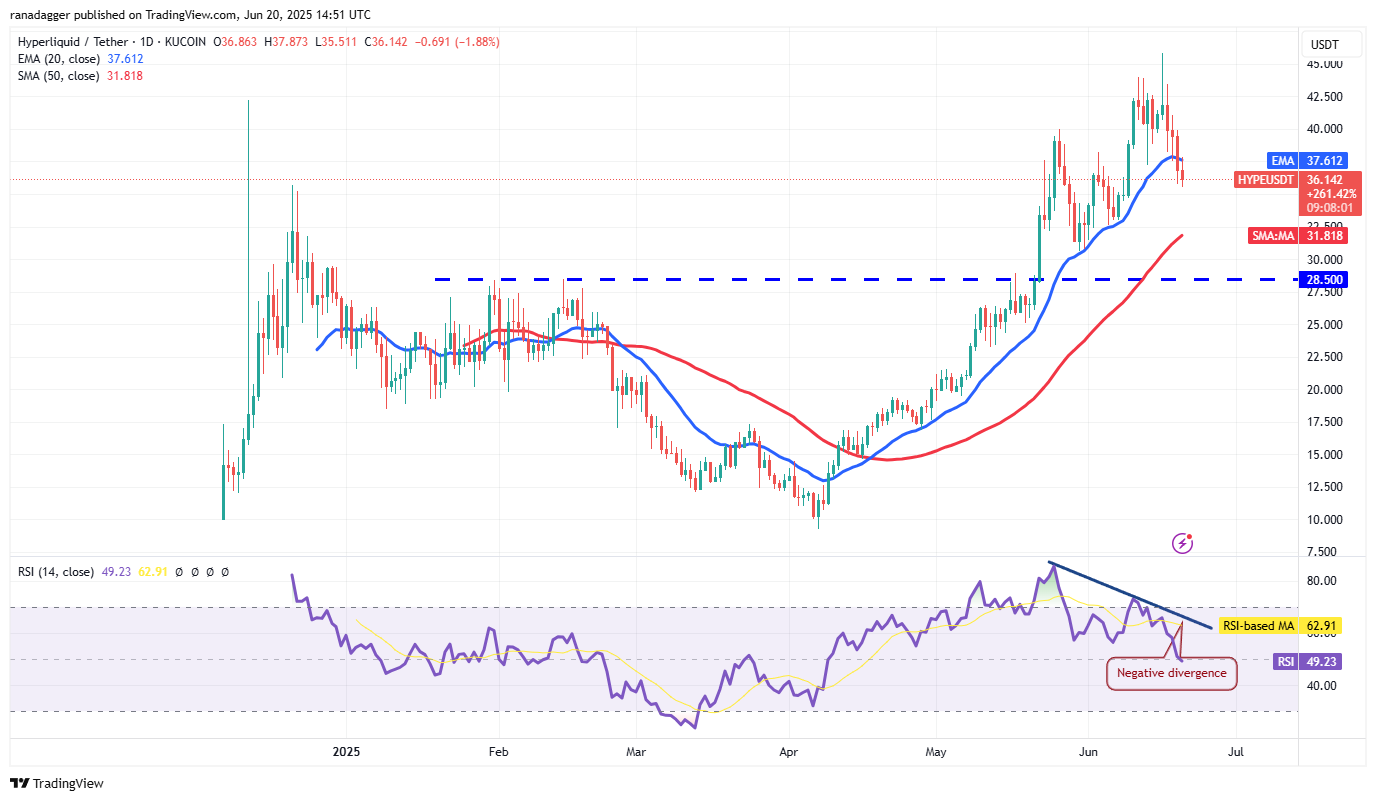
The bears will attempt to solidify their grip by pushing the price down to the 50-day SMA ($31.81). Buyers are likely to defend this level vigorously. A rebound from the 50-day SMA could encounter selling at the 20-day EMA. Should the price drop from the 20-day EMA, the HYPE/USDT pair may plunge to $28.50.
For buyers to regain control, they need to push and maintain the price above the 20-day EMA, indicating strong demand at lower levels. The bulls will then aim to elevate the pair to $42.50.
Bitcoin Cash price prediction
Bitcoin Cash (BCH) rebounded from the $462 level on Thursday and reached the resistance level of $500.
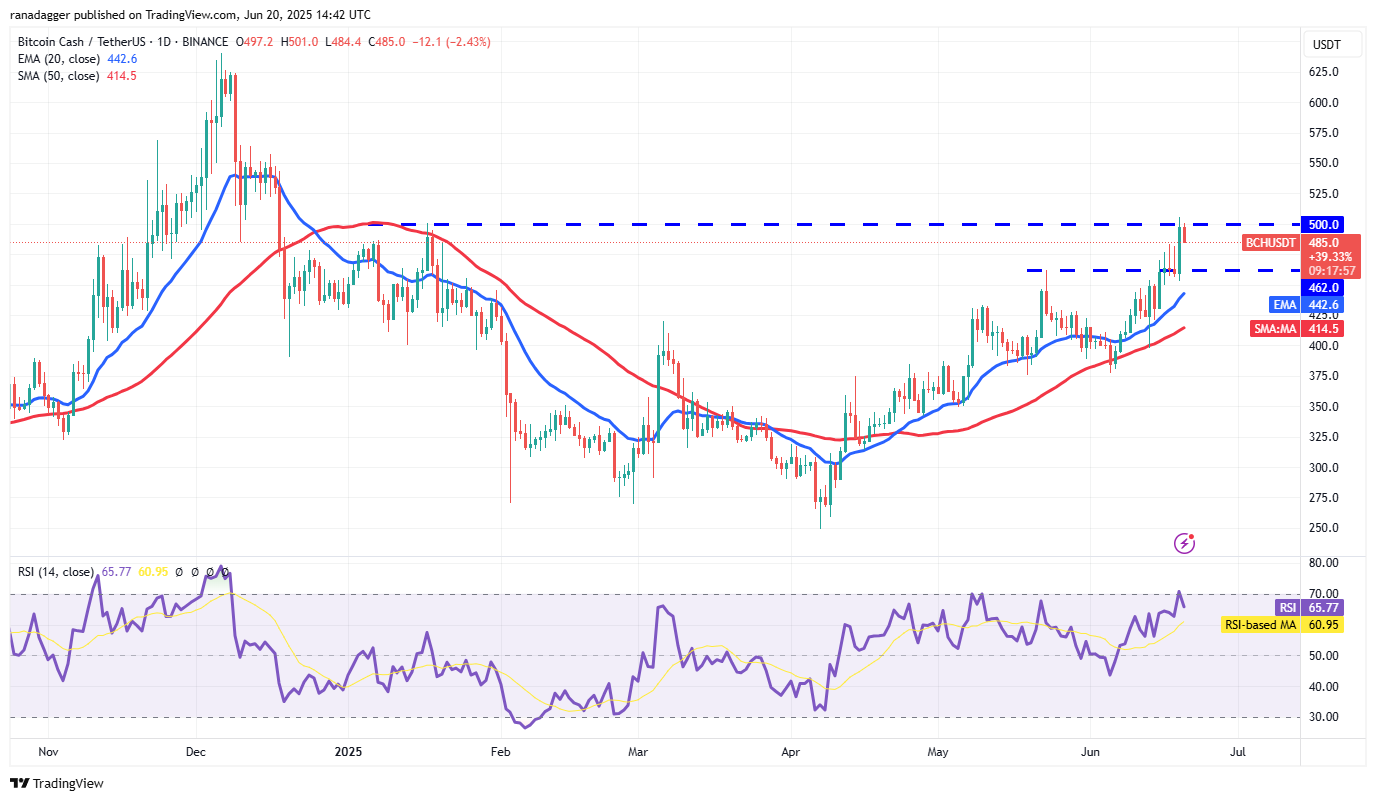
Sellers will attempt to defend the $500 level; however, if buyers hold their ground, the chance of breaking through this resistance increases. If successful, the BCH/USDT pair could reach $550.
Sellers must pull the price below the 20-day EMA ($442) to undermine bullish momentum, potentially leading to a decline toward the 50-day SMA ($414), which is a critical support level to watch.
Sui price prediction
Sui (SUI) has been trading below the $2.86 support since Tuesday, suggesting continued seller pressure.
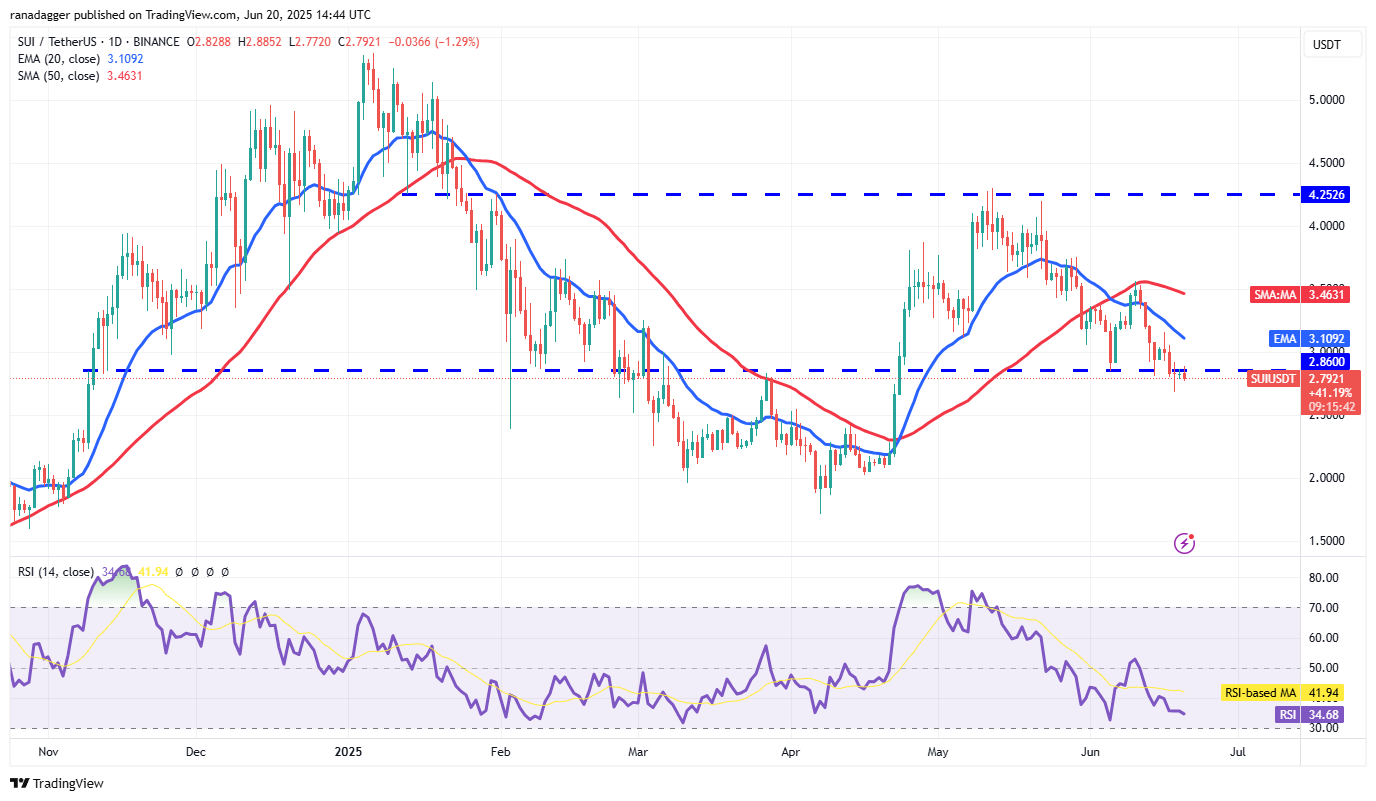
The declining 20-day EMA ($3.10) and the RSI in negative territory indicate an advantage for the sellers. If the price falls below $2.68, the SUI/USDT pair may drop to $2.50 and potentially to $2.
A crucial sign of strength would be a close above the 20-day EMA, suggesting a rejection of the breakdown below $2.86. This could lead to a rise toward the 50-day SMA ($3.46).
This article does not contain investment advice or recommendations. Every investment and trading move carries risks, and readers should conduct their own research when making decisions.