Key points:
-
Bitcoin’s tightening range suggests a potential expansion soon.
-
Some altcoins are experiencing selling pressure but are holding above their short-term support levels.
Bitcoin (BTC) remains under pressure near the $120,000 mark. Frequent retests of resistance can weaken it, but if buyers maintain their position against sellers, BTC’s chances of surpassing its all-time high of $123,218 improve.
Tom Lee, head of research at Fundstrat, mentioned in a CNBC interview that BTC could rise to between $200,000 and $250,000 in the coming months, estimating this would make BTC worth 25% of the gold market value.
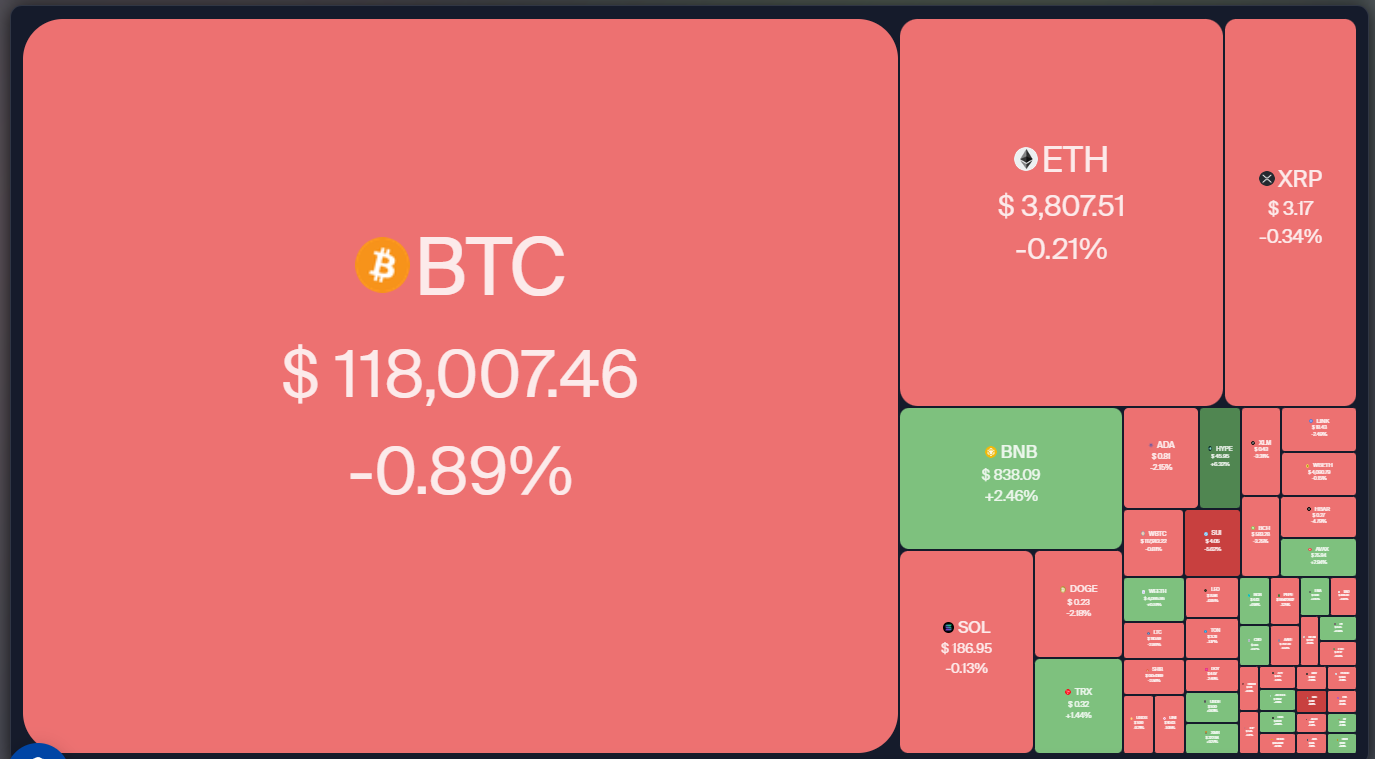
The consolidation of BTC seems to have prompted investors to gravitate towards Ether (ETH), which is on the rise. Spot ETH exchange-traded funds have seen a 16-day inflow streak, increasing net inflows from $4.25 billion on July 2 to $9.33 billion by Friday.
Will BTC breach the overhead resistance, or remain range-bound? Can selected altcoins keep their momentum? Let’s analyze the charts of the top 10 cryptocurrencies to find out.
S&P 500 Index price prediction
The S&P 500 Index (SPX) is progressing toward a target of 6,500, indicating strong demand at elevated levels.
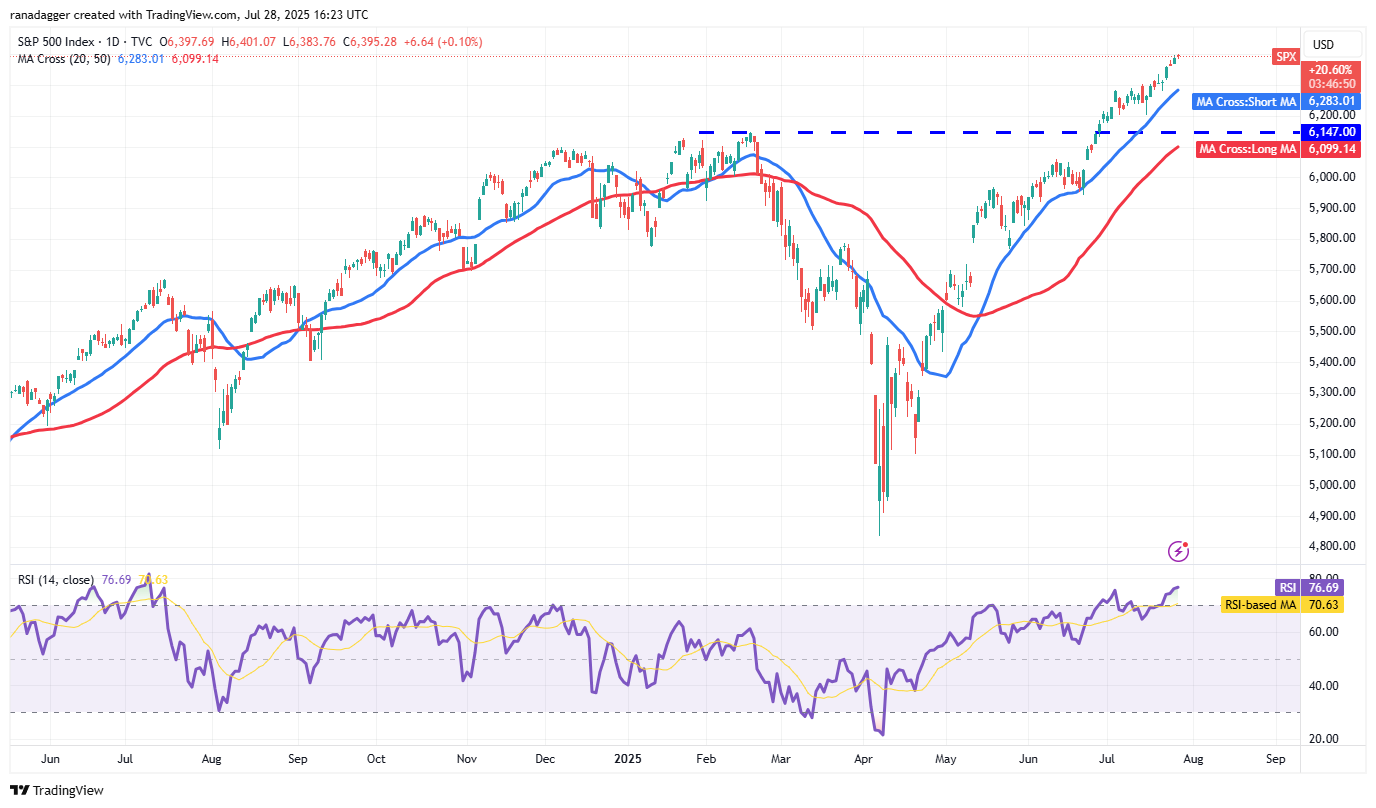
With moving averages trending upward, bulls appear dominant, but the relative strength index (RSI) indicates the rally may be overheating. This raises the potential for near-term consolidation or correction.
Should the price decline but bounce back from the 20-day simple moving average (SMA) (6,283), it would signal continued positive sentiment, enhancing chances of a rise to 6,500. Sellers must push the price below the 50-day SMA (6,099) to take control.
US Dollar Index price prediction
The US Dollar Index (DXY) is striving to remain above the 50-day SMA (97.68), suggesting bulls are attempting to establish a higher low.
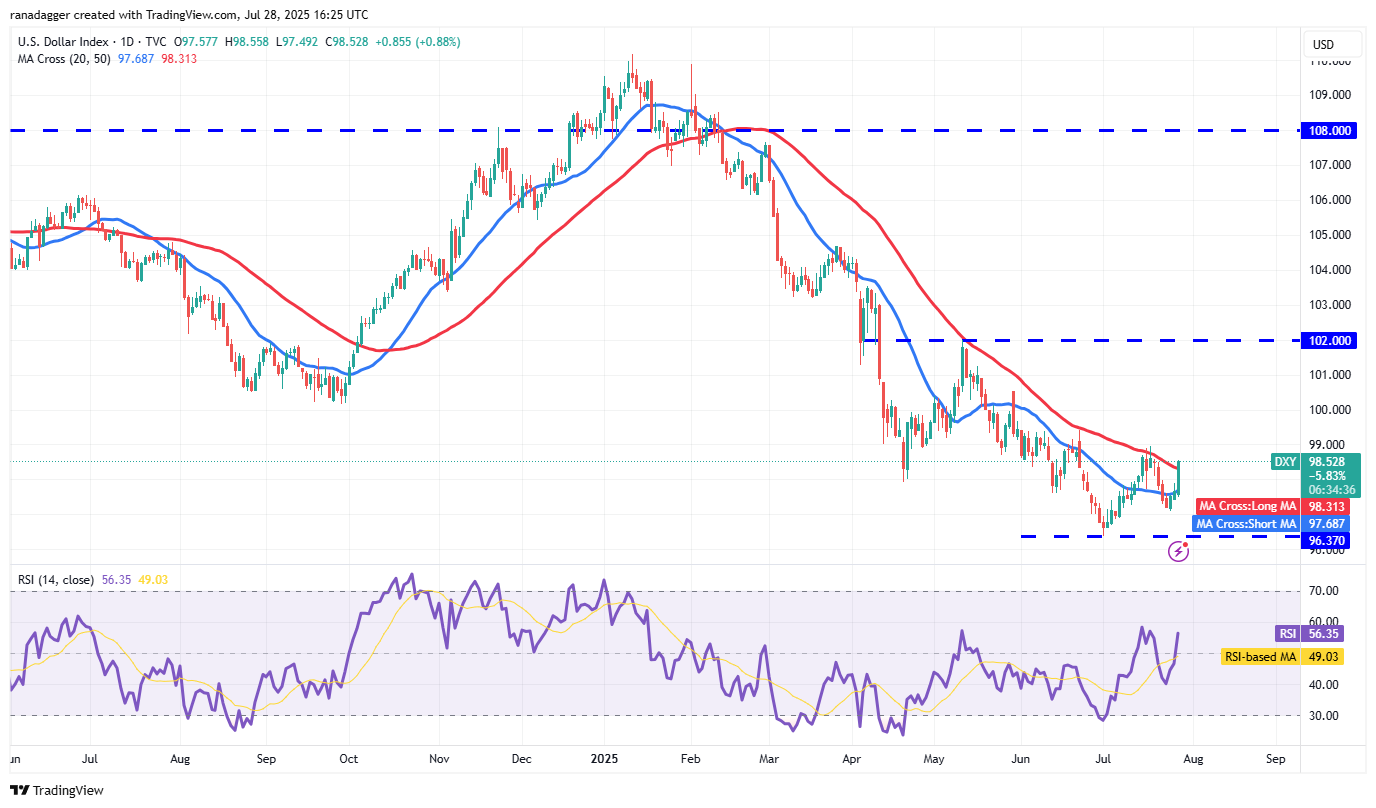
If successful, the index could rise to 100.54 and then 102, where sellers are likely to pose a strong challenge.
Conversely, failing to hold above the 50-day SMA would indicate continued bearish control. Bears will aim to pull the price below 97.10, risking a retest of crucial support at 96.37.
Bitcoin price prediction
BTC dipped below the 20-day SMA ($117,867) on Friday; however, the long tail on the candlestick indicates robust buying interest at lower levels.
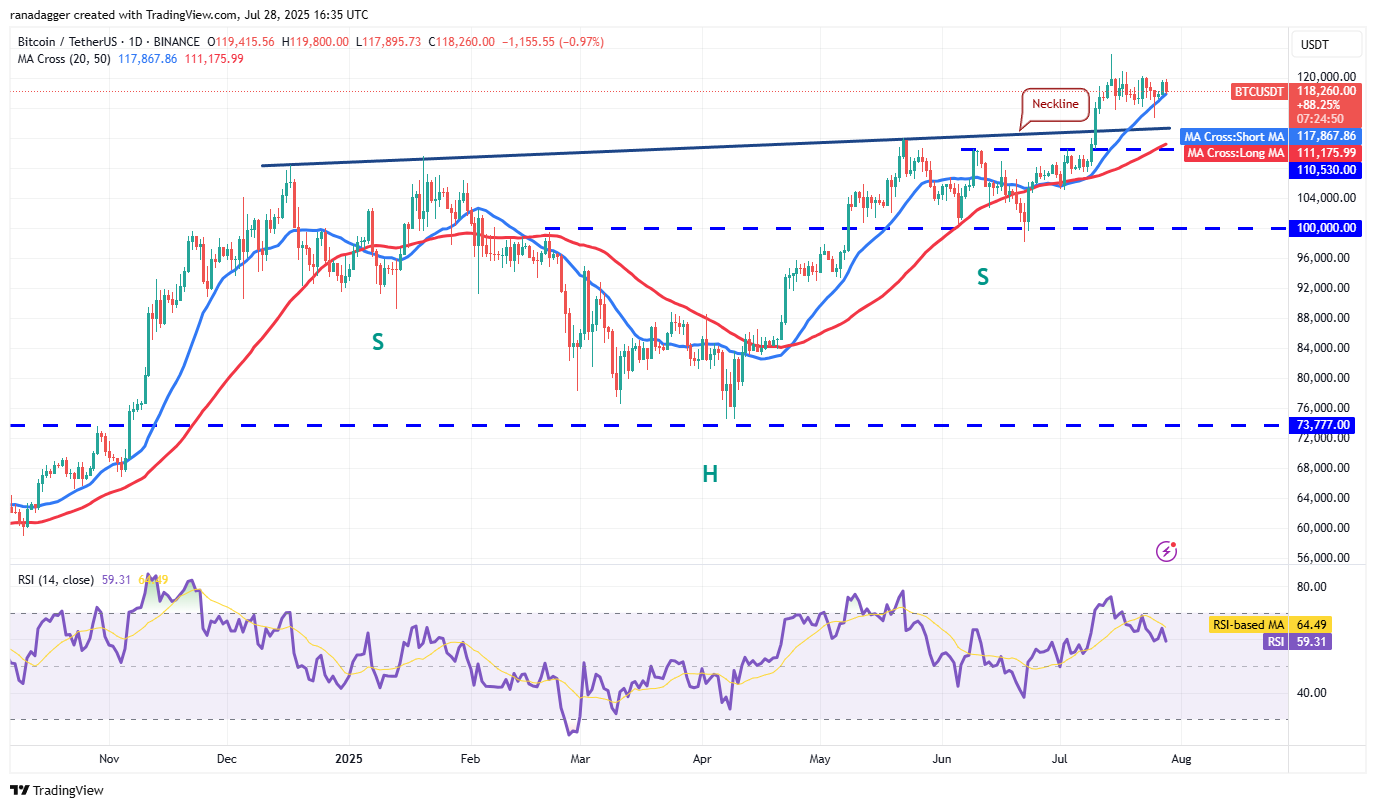
Bulls are attempting to push the BTC/USDT pair above the resistance zone of $120,000 to $123,218. If successful, the pair could accelerate towards $135,728 and eventually reach the target of $150,000.
The bears must act quickly; if they wish to regain momentum, they need to pull the price below the $110,530 support. Failure to do so may lead to a decline to the psychological support at $100,000.
Ether price prediction
Ether broke above the $3,745 resistance on Sunday, but bulls are currently struggling to maintain these higher levels.
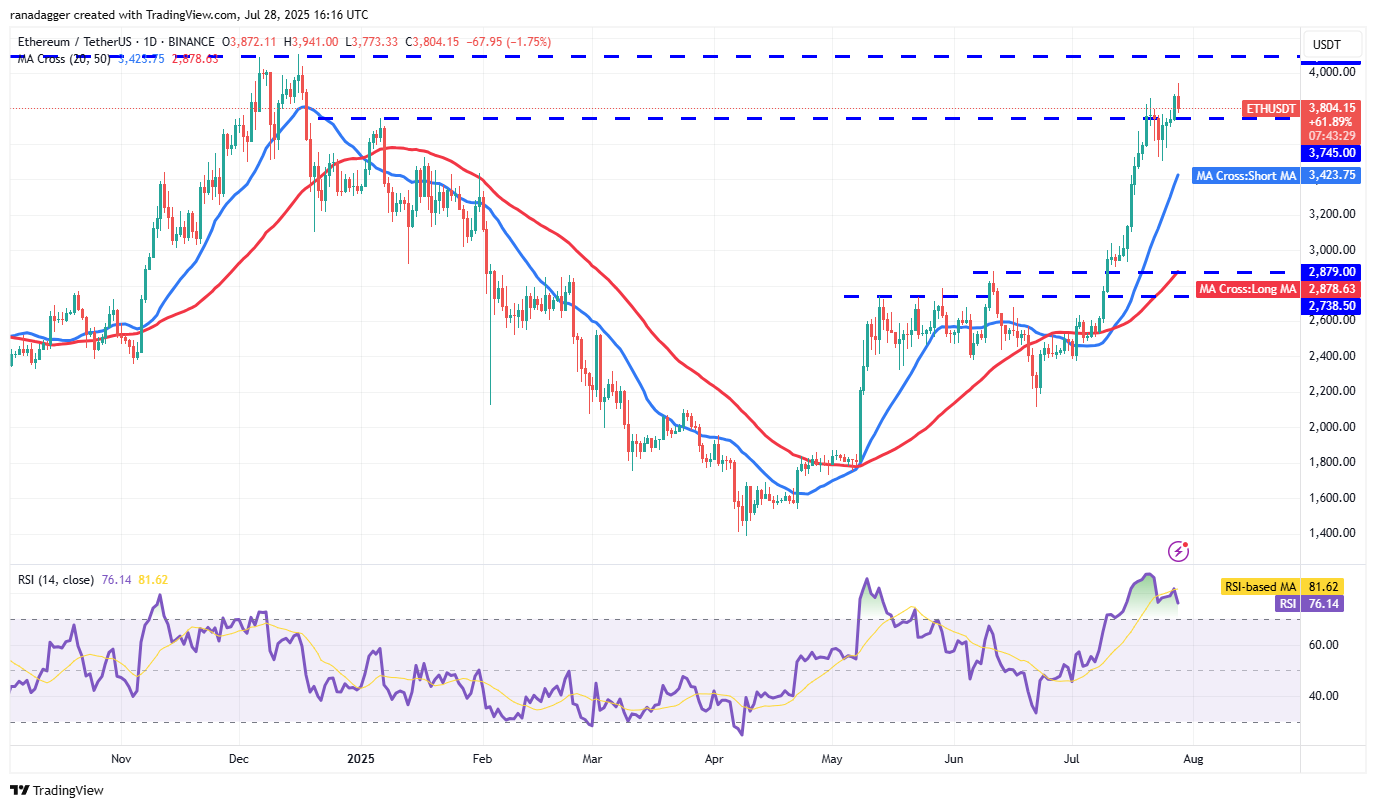
Sellers will attempt to pull the price below $3,745. If achieved, the ETH/USDT pair may decline to the 20-day SMA ($3,423). Buyers are expected to protect the 20-day SMA, as a breach would indicate a deeper correction.
If the price bounces back from either the $3,745 level or the 20-day SMA with strength, it reflects buying on dips. Bulls will then aim for $4,094, and if surpassed, the pair could rise to $4,868.
XRP price prediction
XRP’s (XRP) retreat from $3.66 found support at the 20-day SMA ($3.10) on Thursday, indicating buying on dips.
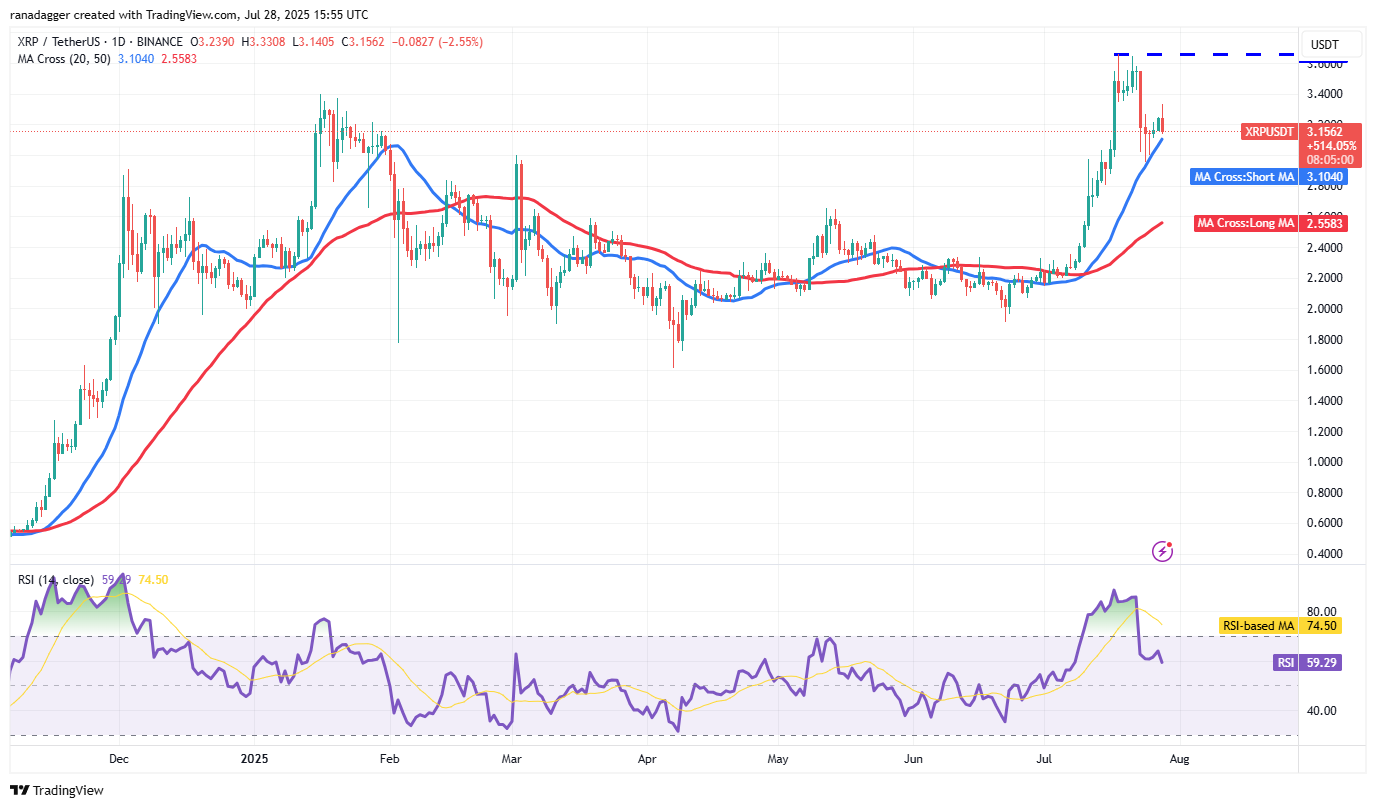
The bulls attempted to push the price toward $3.66; however, they faced significant resistance from bears. A continued drop breaking below the 20-day SMA would signal a deeper correction, potentially leading the XRP/USDT pair to $3 and then $2.80.
If the price rebounds from the 20-day SMA, it would suggest that bulls are defending that level. The pair could then rise to $3.66, and a break and close above this resistance might propel the pair to $4, and subsequently to $4.86.
BNB price prediction
BNB (BNB) fell from $809 on Wednesday, but the bears could not maintain the price below $761, suggesting the bulls converted it into a support level.
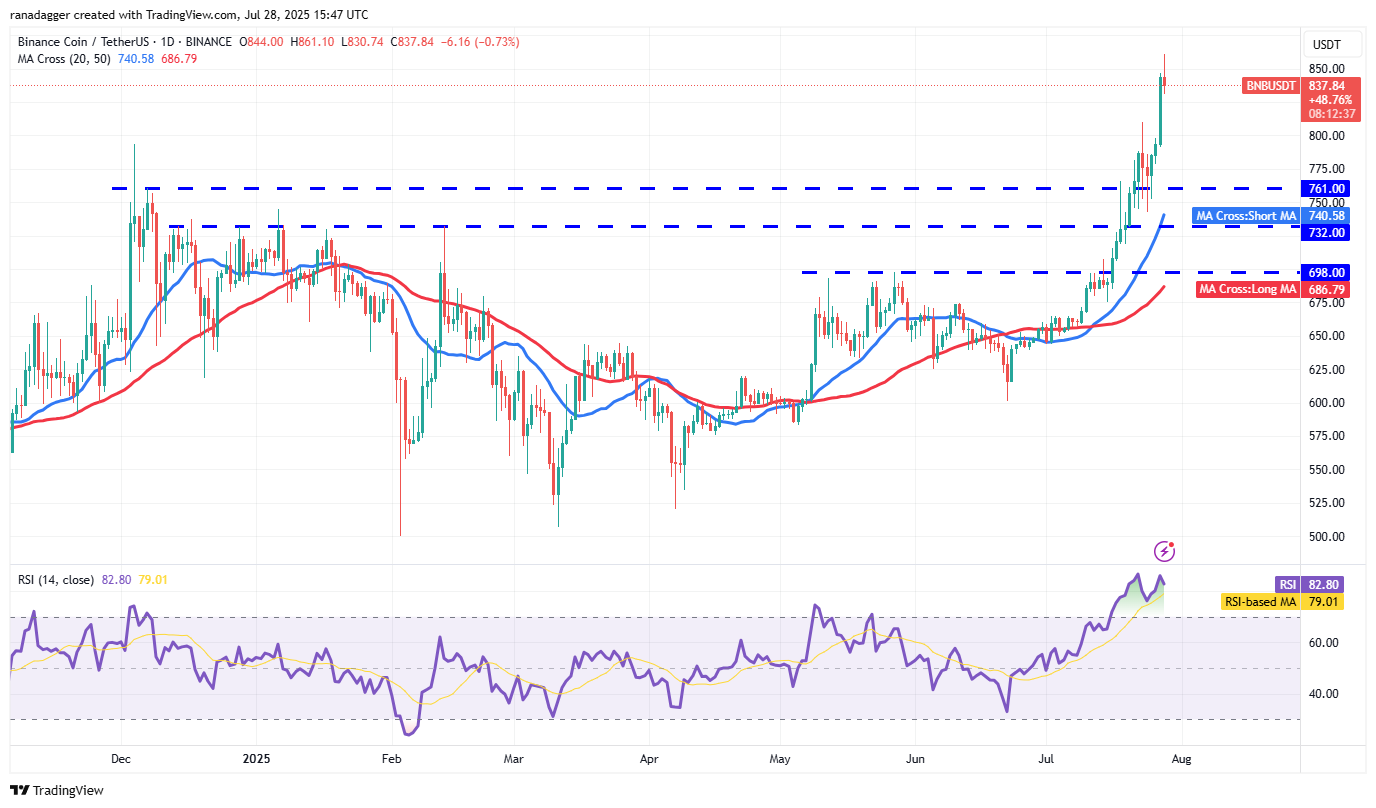
Buyers pushed the price above $809 on Sunday, initiating the next leg of the uptrend. The BNB/USDT pair could target $900 and then the psychological level of $1,000.
While the trend remains upward, the RSI’s overbought condition indicates that a consolidation or correction may be on the horizon. A significant weakness would be indicated by a close below $793, suggesting profit-taking at higher levels. The pair may then drop to $761, where buyers are expected to re-enter.
Solana price prediction
Solana’s (SOL) retreat from $209 on Wednesday halted at the 20-day SMA ($176) on Friday, indicating demand at lower levels.
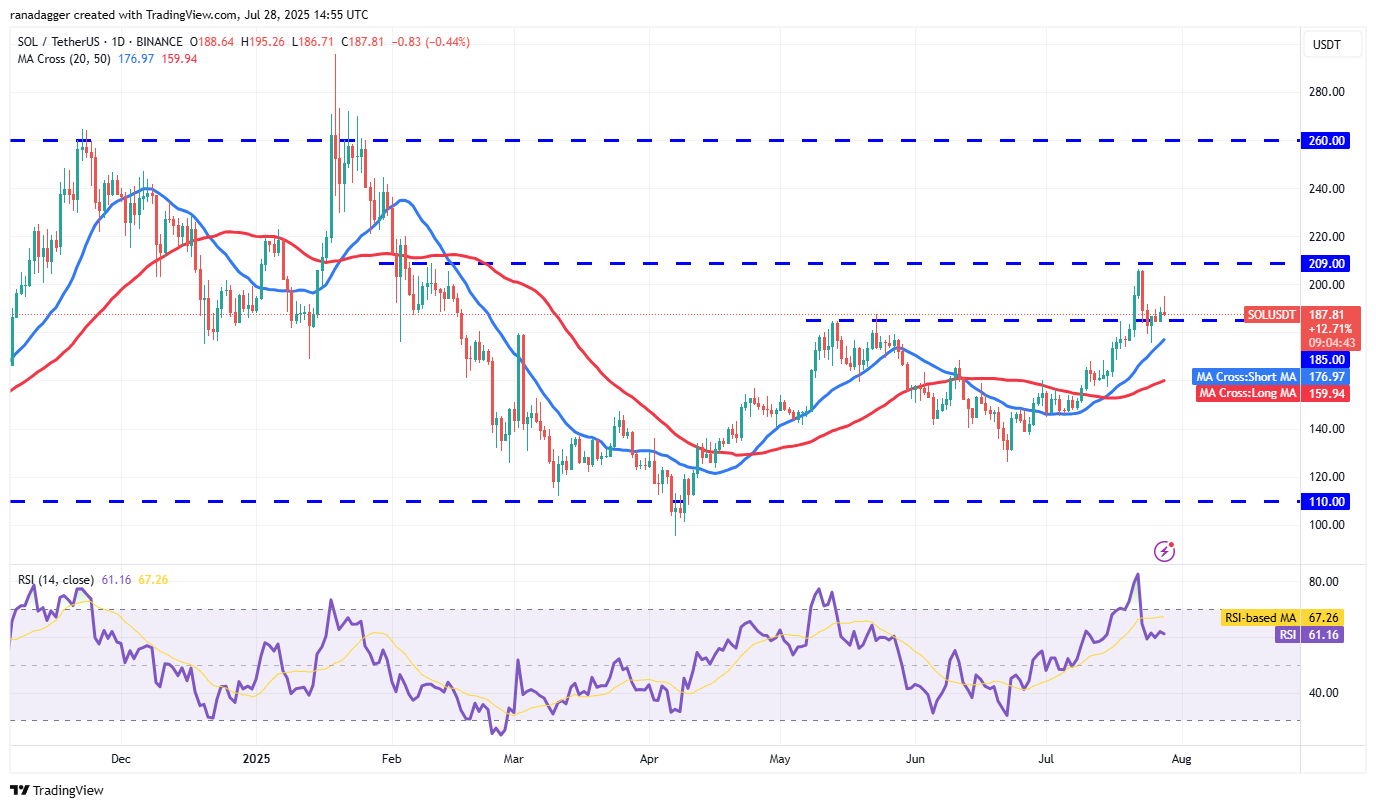
Bulls are attempting to bring the price to $209, facing selling pressure at elevated levels. If buyers surpass the $209 barrier, the SOL/USDT pair could rally to $240 and later to $260, though some resistance is expected around $220.
This optimistic outlook would be invalidated if the price declines below the 20-day SMA, leading to a possible drop to the 50-day SMA ($160). This suggests the potential for range-bound trading between $110 and $209.
Related: XRP price to $4 next? ‘Most profitable phase’ likely here, says analyst
Dogecoin price prediction
Dogecoin (DOGE) rebounded from the 20-day SMA ($0.22) on Friday, indicating buying interest at lower levels.
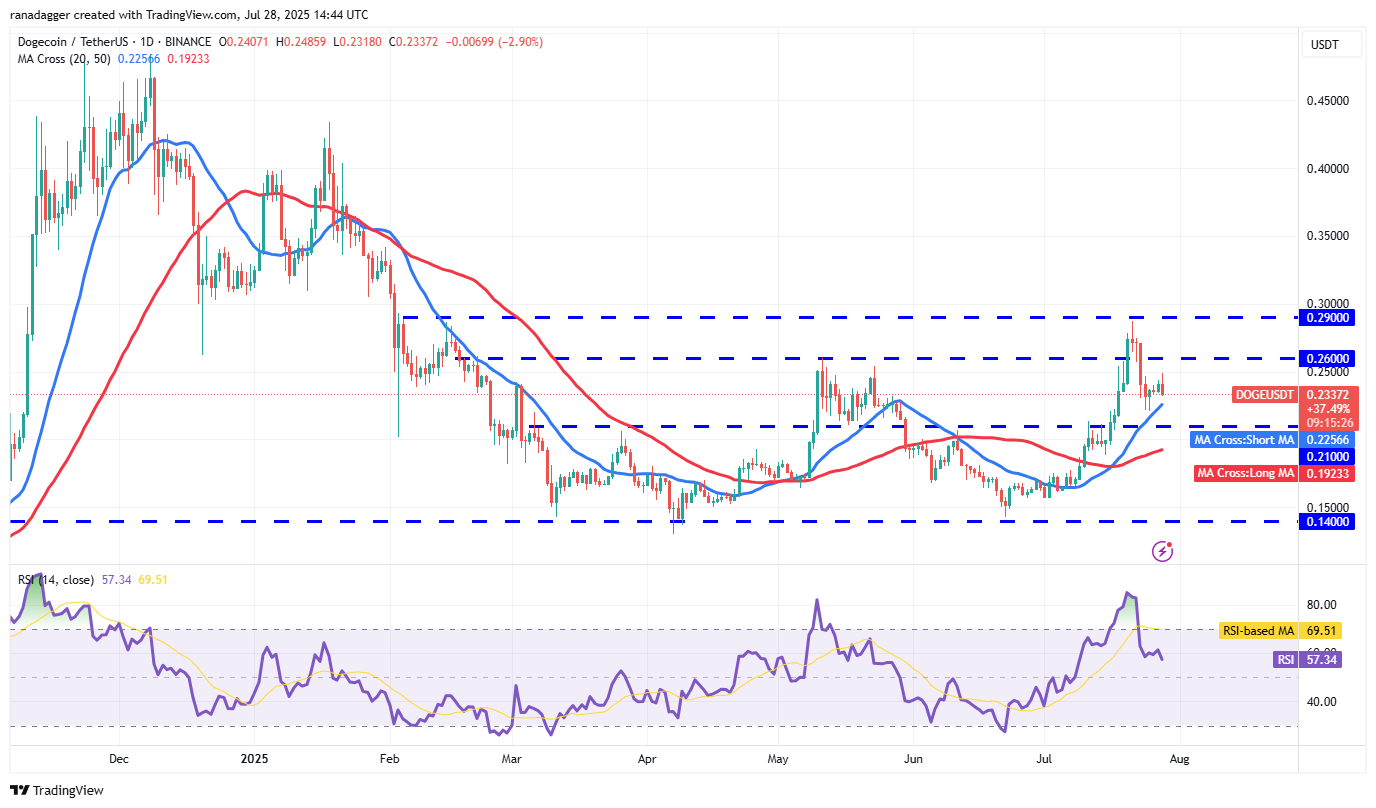
The relief rally is encountering selling near $0.26, illustrating the bears are active at higher price levels. If the price falls below the 20-day SMA, the DOGE/USDT pair may remain within the broad range of $0.14 to $0.29 for a longer period.
To regain control, buyers need to raise the price above $0.29. If they succeed, the pair could initiate a new upward movement to $0.35 and eventually reach the target of $0.44.
Cardano price prediction
Cardano’s (ADA) bounce from the 20-day SMA ($0.78) is facing resistance at $0.86.
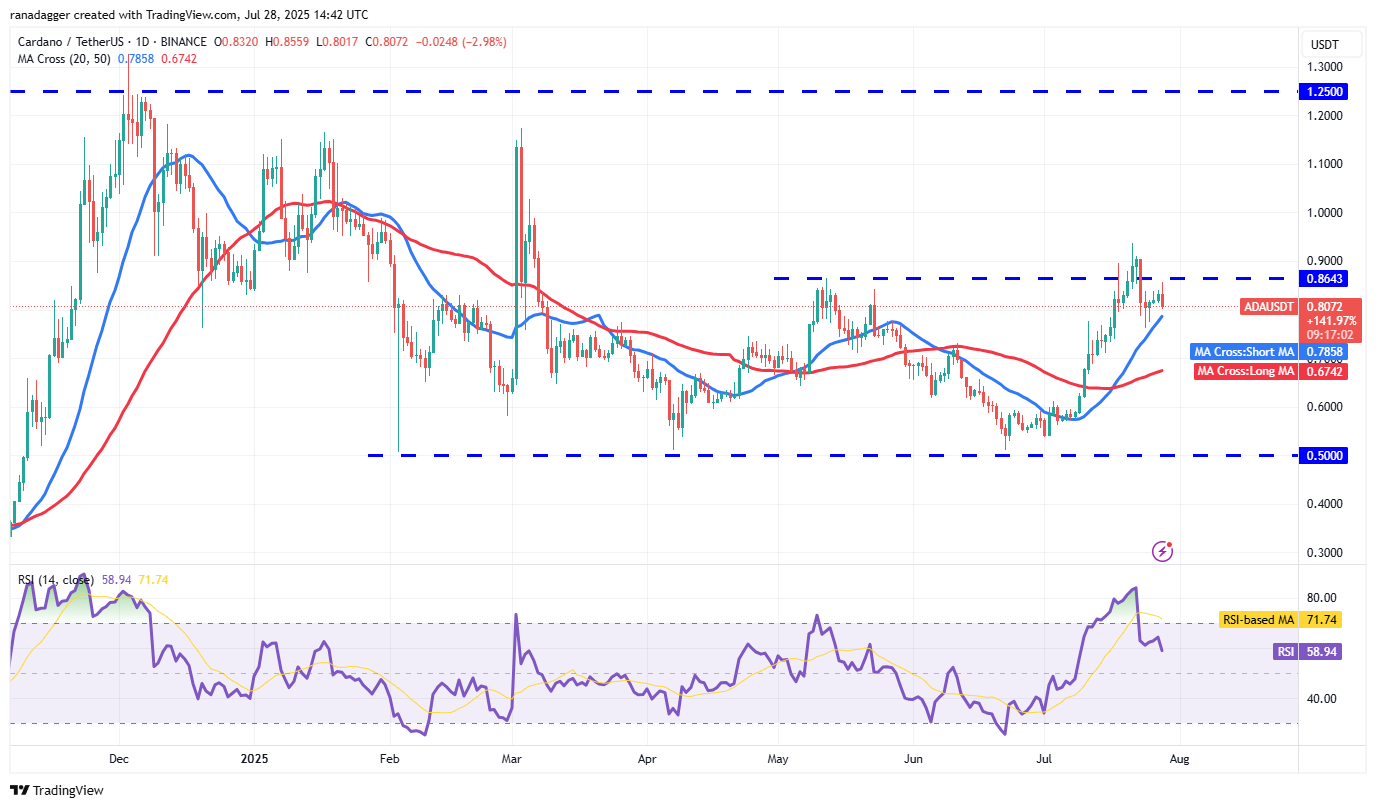
The rising 20-day SMA and positive RSI signal a bullish edge. A break above $0.86 could lead the ADA/USDT pair toward $0.94. Sellers will likely try to halt progress at $0.94; if the bulls continue to prevail, the pair could surge to $1.02 and then to $1.17.
The short-term advantage would shift to the bears if the price drops below the 20-day SMA, indicating profit-taking during rallies. The pair might then decline to the 50-day SMA ($0.67).
Hyperliquid price prediction
Hyperliquid (HYPE) bounced off the support line of its ascending channel on Friday, signaling buying on dips.
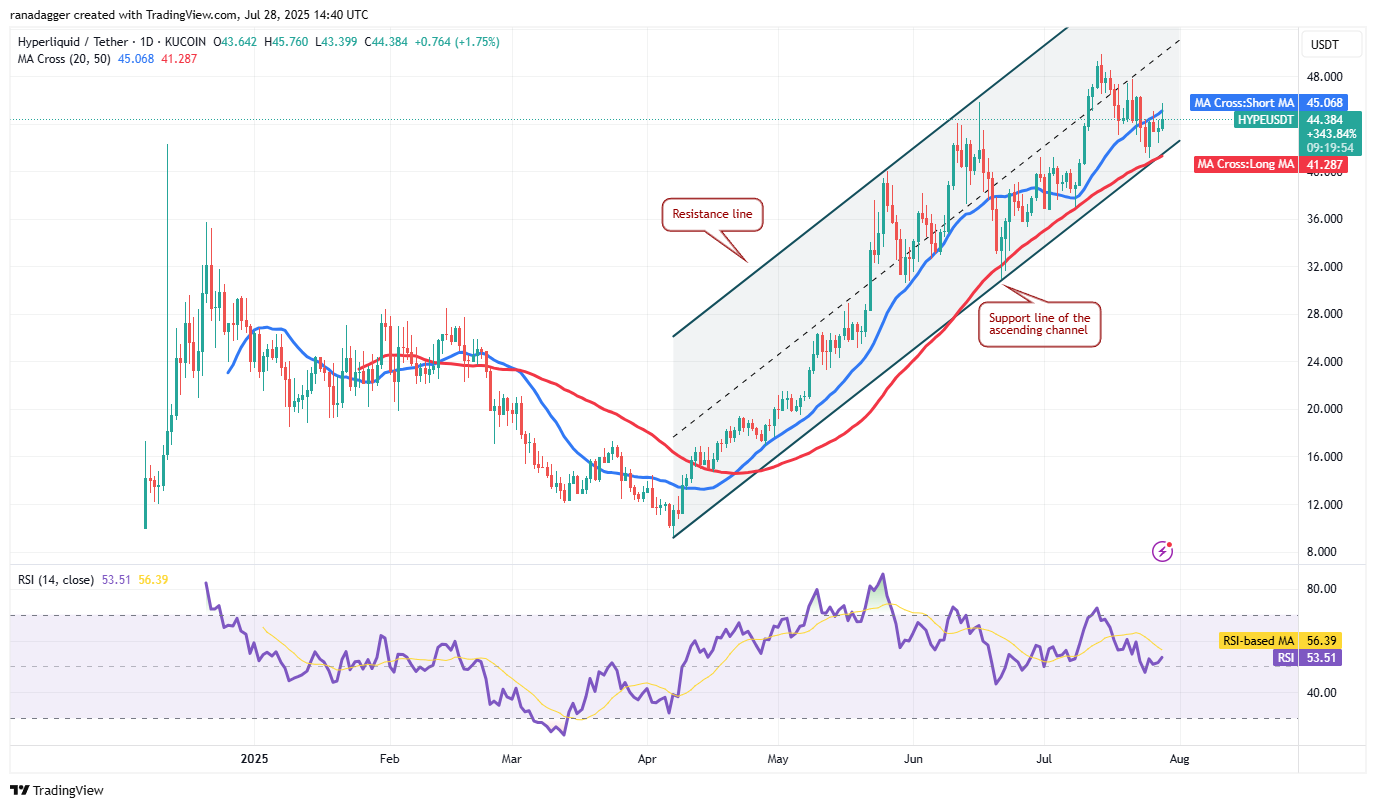
Resistance is present at the 20-day SMA ($45.06); if bulls can overcome it, the HYPE/USDT pair may rise to $48 and then $50. Sellers are expected to defend the $50 mark vigorously.
If the price retreats from the 20-day SMA, bears will attempt to push the pair below the support line. If successful, the pair may face a deeper correction toward $36 and $32.
This article does not contain investment advice or recommendations. Every investment and trading move involves risk, and readers should conduct their own research when making a decision.