Key points:
-
Sellers pushed the price below $115,000, but maintaining those levels has been difficult.
-
Multiple altcoins have retreated toward their respective support levels, which are expected to hold.
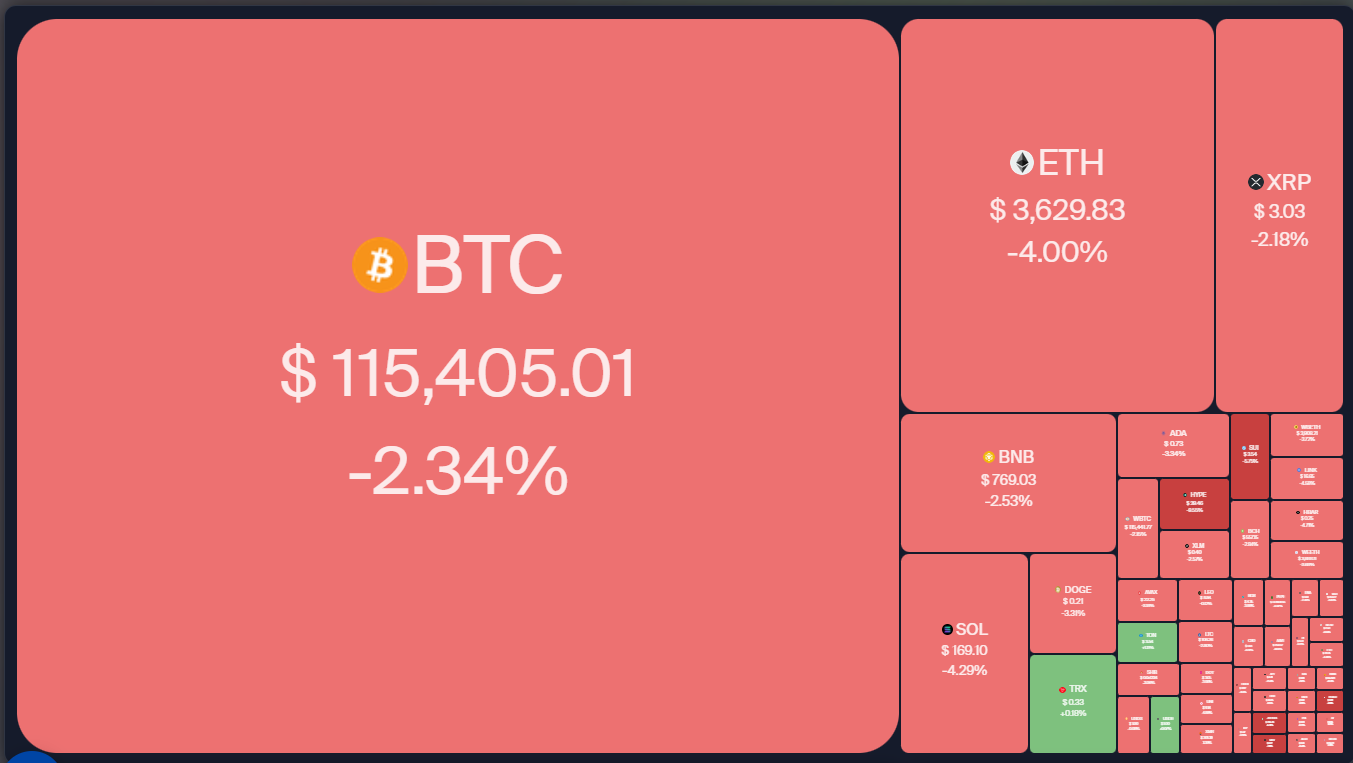
Bitcoin (BTC) fell beneath the $115,000 support on Friday, but the decline may be limited. Bitcoin treasury firms have been actively purchasing, accumulating over 791,662 BTC valued at approximately $93 billion, as noted in a Galaxy Research report released on Thursday.
BTC increased by more than 8% in July, and analysts anticipate that this upward trend will persist, even though August has historically only seen average monthly gains of about 1.61%. The optimistic outlook stems from BTC’s performance in August following previous halvings, which recorded significant gains of 30%, 65%, and 14% in 2013, 2017, and 2021, respectively. If history is any guide, BTC could surge to a new all-time high exceeding $123,218 in the coming month.
Furthermore, Ether (ETH) has attracted considerable institutional interest. US spot ETH exchange-traded funds (ETFs) reported net inflows of $5.43 billion in July, a significant rise from June’s inflows of $1.16 billion, according to ETF tracker SoSoValue.
What are the key support levels for BTC and the altcoins? Let’s analyze the charts of the top 10 cryptocurrencies to find out.
Bitcoin price prediction
The BTC price retraced to the neckline of the inverse head-and-shoulders pattern, a crucial level to monitor.
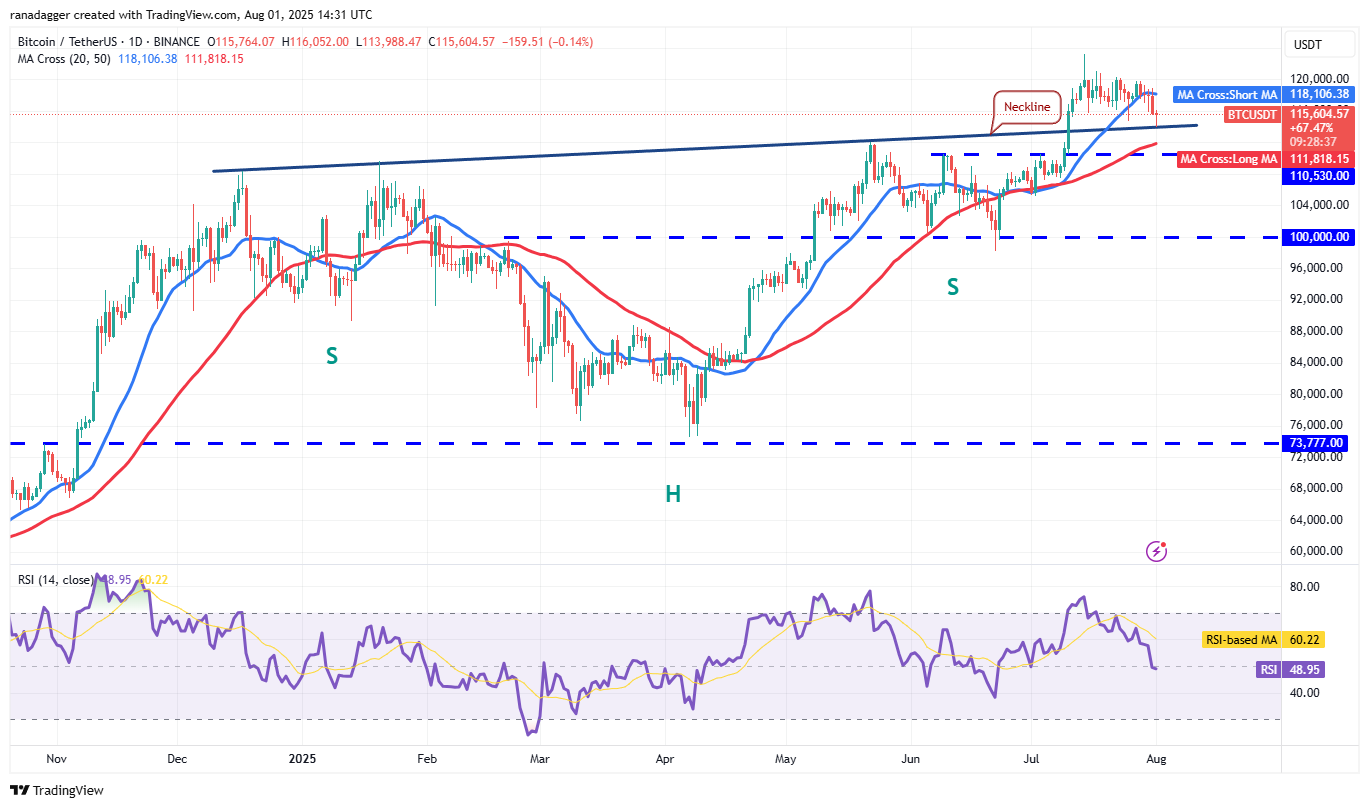
A strong rebound off the neckline would indicate that bulls are attempting to convert this level into support. A breakthrough above the 20-day simple moving average (SMA) ($118,106) would bolster the chances of a rally to $123,218. While sellers are likely to defend the $123,218 level fiercely, if buyers succeed, the BTC/USDT pair could soar to $135,000.
The range between the neckline and $110,530 is expected to see solid buying from bulls, as a breakdown below could trigger increased selling pressure. In such a case, the pair might drop to $105,000 and ultimately revisit $100,000.
Ether price prediction
ETH closed below the support at $3,745 on Thursday, indicating profit-taking by short-term traders.
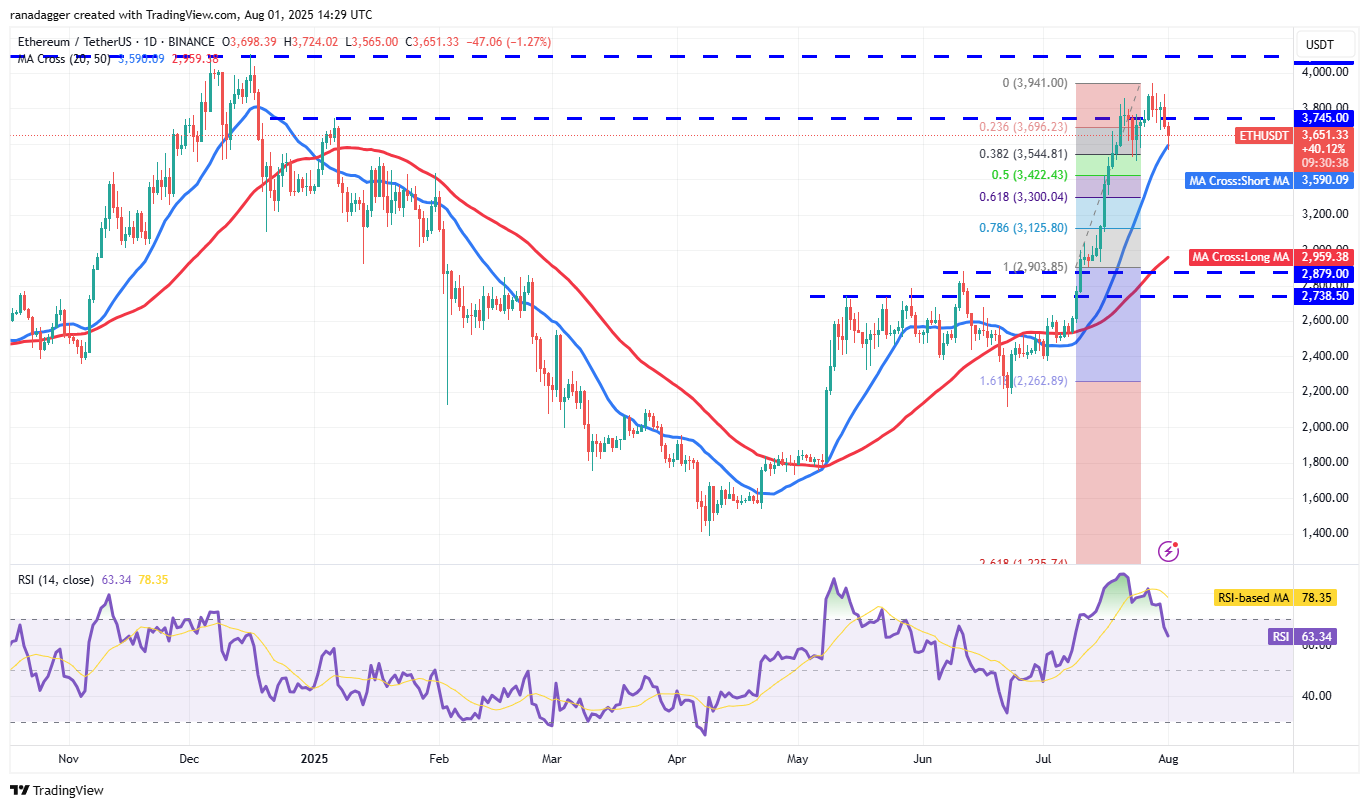
The price has now reached the 20-day SMA ($3,590), a crucial support to observe. If the price bounces off the 20-day SMA with strength, bulls will aim to push the ETH/USDT pair above $3,941. Should they succeed, the pair could rise to $4,094, where sellers are anticipated to defend.
If the price breaks and closes below the 20-day SMA, it could fall to the 50% Fibonacci retracement level of $3,422 and subsequently to the 61.8% level of $3,300.
XRP price prediction
Buyers attempted to elevate XRP (XRP) above the 20-day SMA ($3.19) on Thursday, but bears resisted.
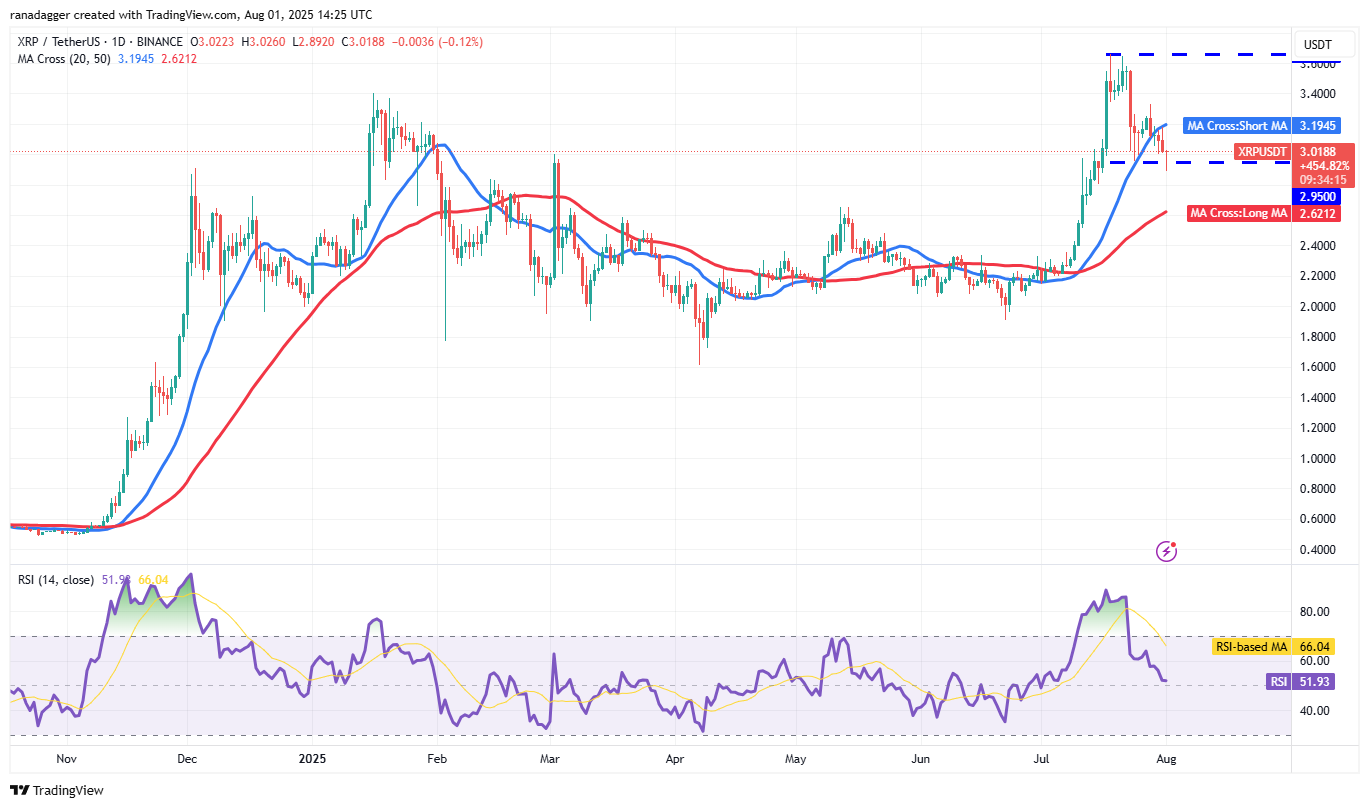
Sellers pushed the price below the critical support of $2.95, but the long candlestick tail reflects robust buying at lower levels. Bulls will once again attempt to lift the XRP/USDT pair above the 20-day SMA. If successful, it may fluctuate between $2.95 and $3.66 for a while.
Conversely, if the price declines and closes below $2.95, it indicates a rush for the exit by bulls and heightens the risk of a drop to the next significant support at the 50-day SMA ($2.62).
BNB price prediction
BNB (BNB) closed below the breakout level of $794 on Thursday and reached the 20-day SMA ($761) on Friday.
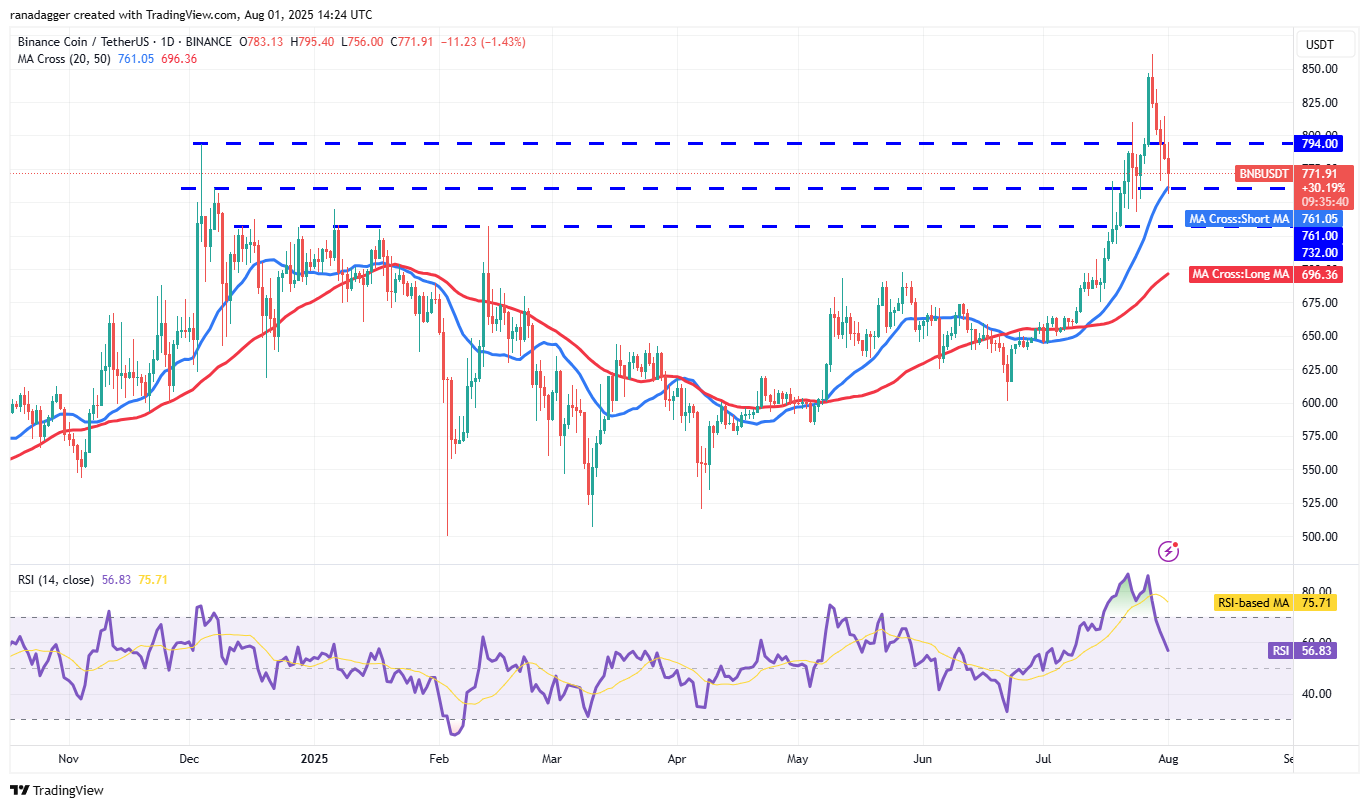
Buyers are expected to staunchly defend the 20-day SMA, as a dip below this level could plunge the BNB/USDT pair to $732. A more considerable correction might delay the next uptrend phase.
Conversely, a solid rebound off the 20-day SMA would signal buying interest at lower levels. In that case, buyers would look to push the pair above $794. If they succeed, the pair might retest the resistance at $861.
Solana price prediction
Sellers hindered the bulls’ attempts to sustain Solana (SOL) above the 20-day SMA ($179) on Thursday.
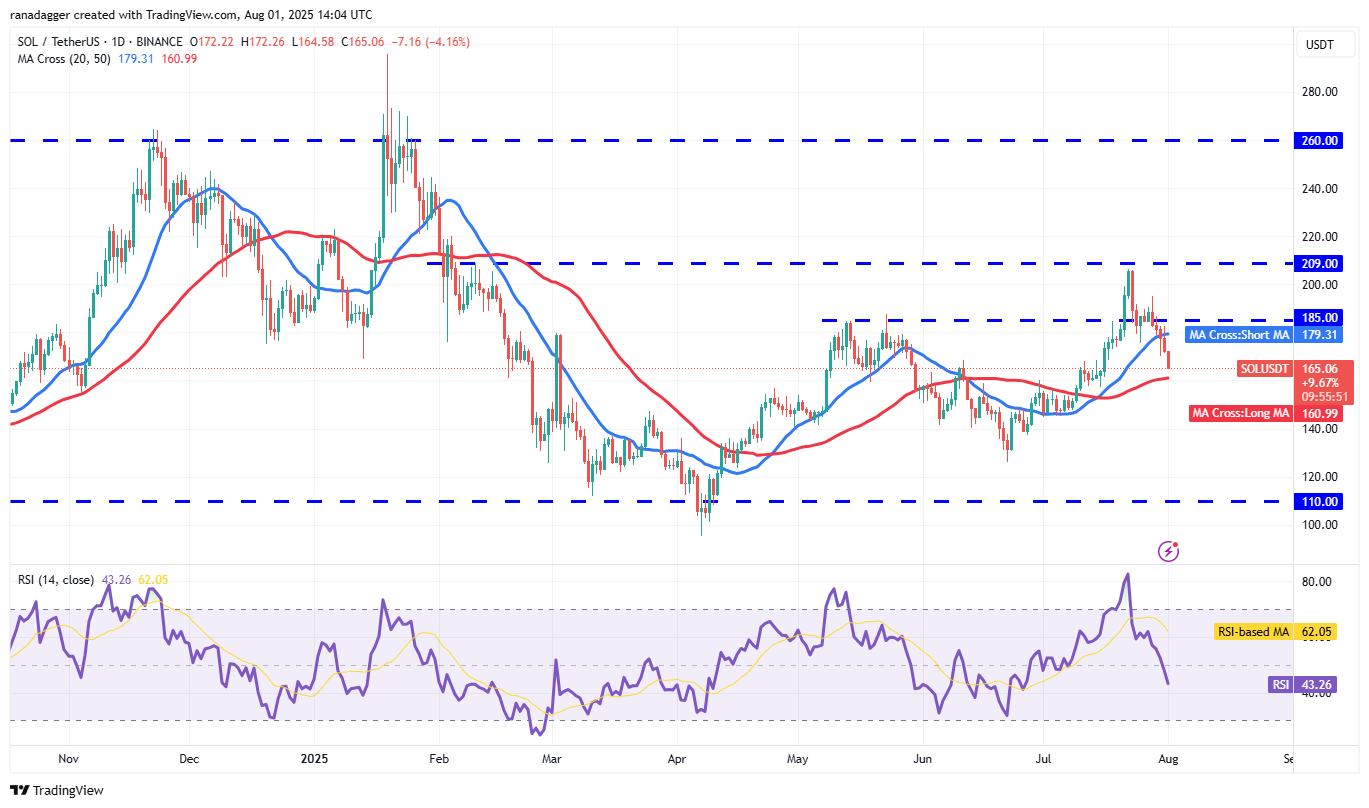
The next support is at the 50-day SMA ($161). If the price bounces off this level, bulls will attempt to push the SOL/USDT pair above $185. Successful bulls could accelerate the rally toward $209.
However, if the price breaks and closes below the 50-day SMA, it favors the bears, potentially dragging the pair down toward $126, prolonging its range between $209 and $110.
Dogecoin price prediction
Dogecoin (DOGE) rebounded from the $0.21 support on Wednesday, yet bulls were unable to elevate the price beyond the 20-day SMA ($0.22).
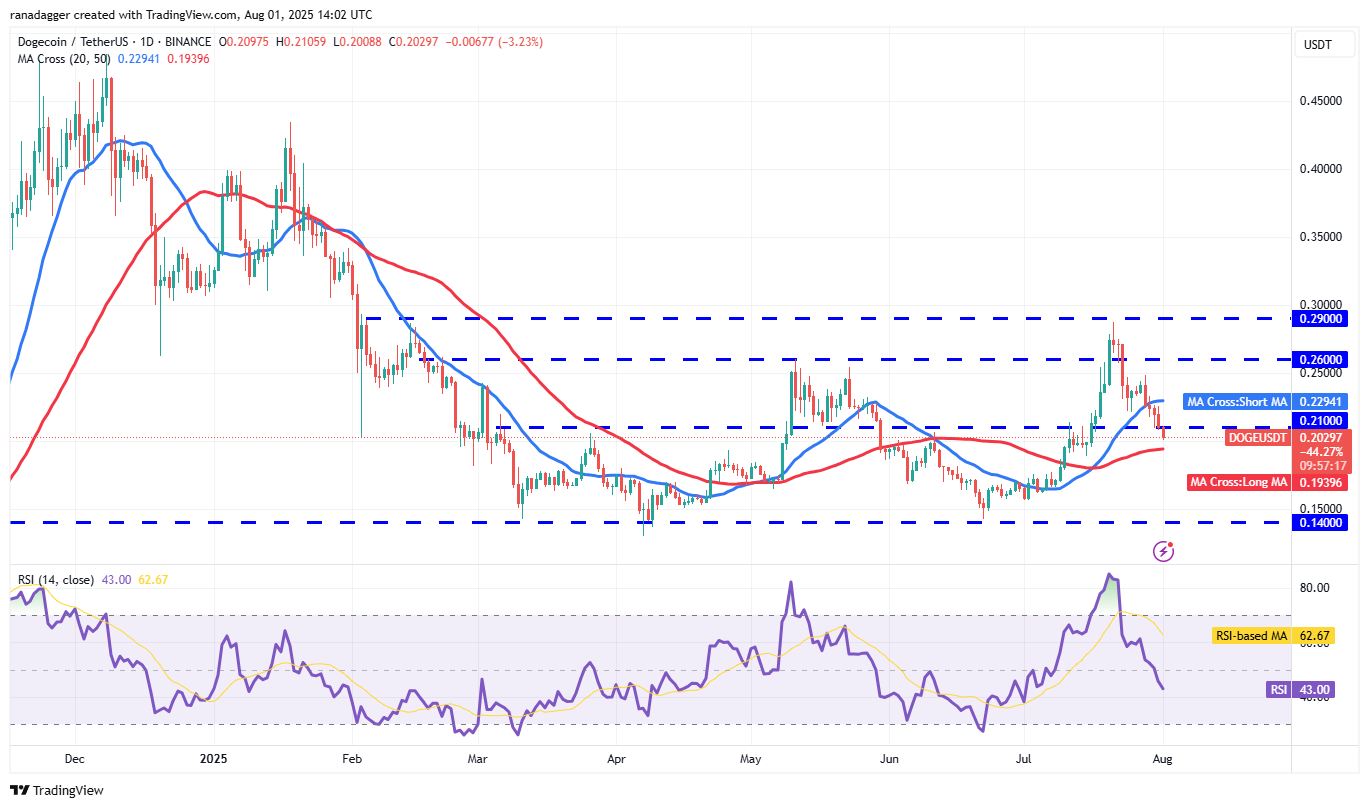
Bears took the opportunity to sell near the 20-day SMA, pushing the price below the $0.21 support. This suggests that the DOGE/USDT pair could remain in the larger range between $0.14 and $0.29 for a few more days.
The next support level is at the 50-day SMA ($0.19). If the price rebounds from this level, bulls will attempt to push above the 20-day SMA. Conversely, a decline below the 50-day SMA may allow for a drop toward $0.14.
Cardano price prediction
Cardano (ADA) has been gradually declining toward the 50-day SMA ($0.67), indicating waning bullish momentum.
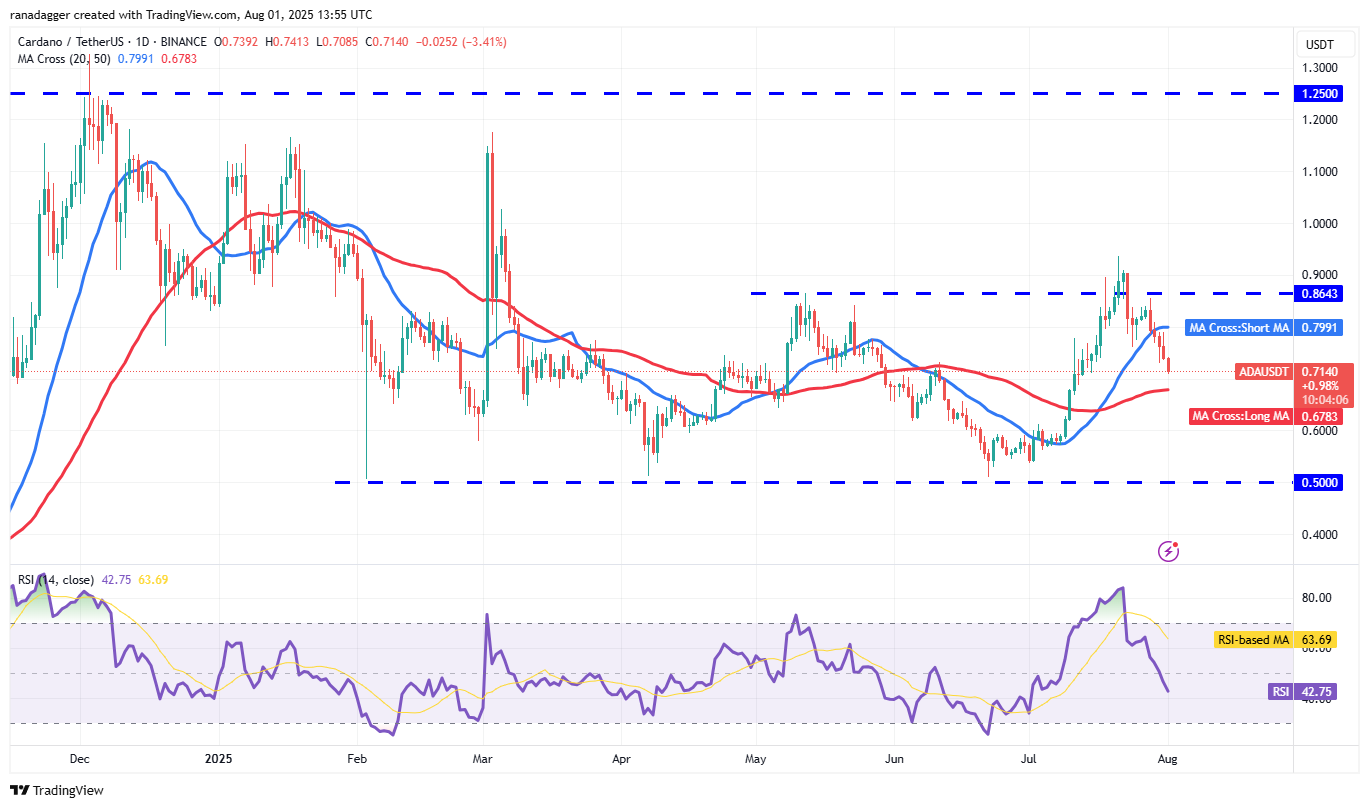
Both moving averages are leveling off, and the RSI is just below the midpoint, signaling potential range-bound behavior in the near term. A bounce from the 50-day SMA is likely to face resistance at the 20-day SMA ($0.79).
Related: Bitcoin traders warn $123K was a top: How low can BTC price go?
If the price retreats from the 20-day SMA and falls below the 50-day SMA, it indicates bearish control, which could see the ADA/USDT pair decline to $0.56 and eventually to the significant support level at $0.50.
Hyperliquid price prediction
Hyperliquid (HYPE) declined from the 20-day SMA ($44.39) on Thursday and closed beneath the ascending channel.
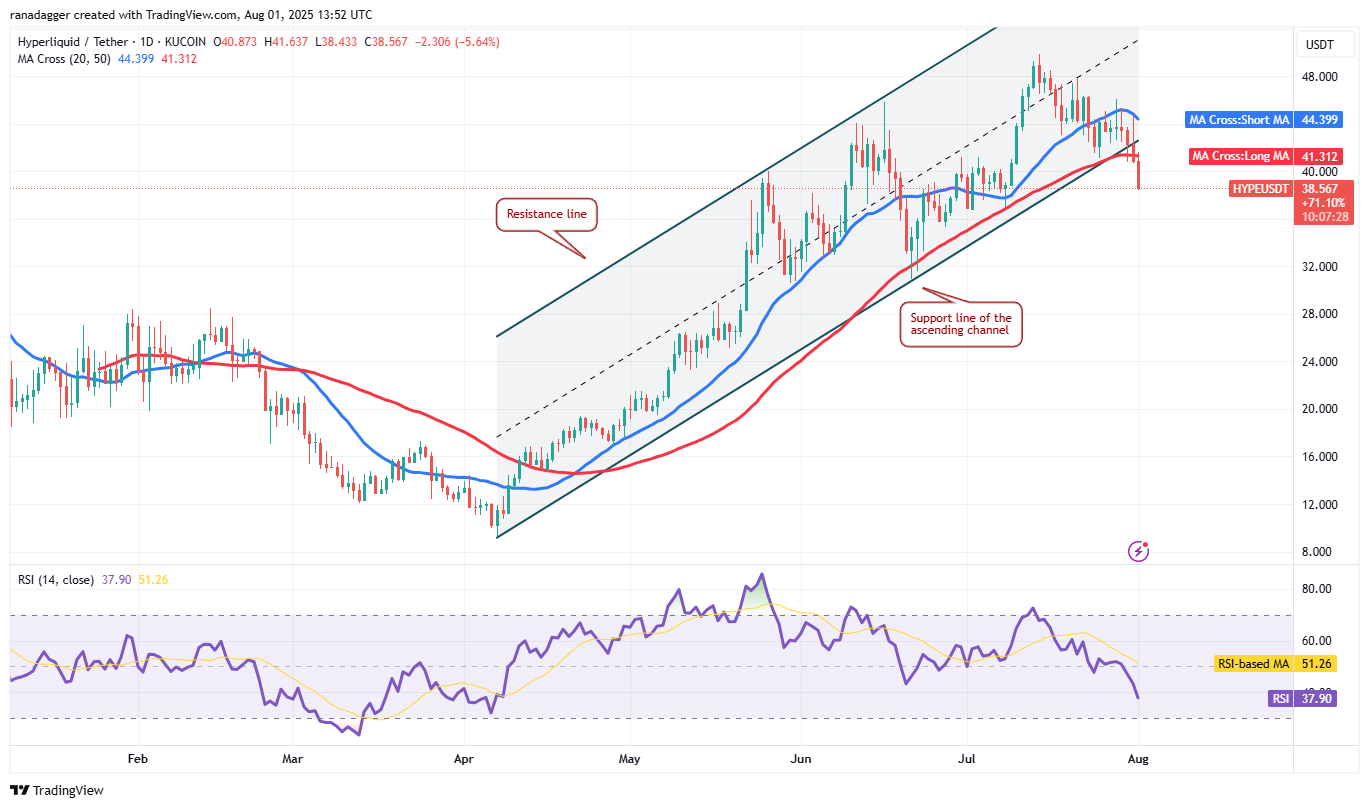
The HYPE/USDT pair may drop to $36, likely to serve as strong support. Buyers will attempt to return the price to the channel but might encounter resistance at the breakdown level. If the price fails to maintain this support line, it indicates that bears have turned it into resistance, potentially leading to a deeper correction down to $32.
Buyers must act quickly to push the price above the 20-day SMA to avert further declines. Such a rebound would suggest that the breakdown was a bear trap, possibly leading to a rally toward $48 and subsequently $49.87.
Stellar price prediction
Stellar’s (XLM) pullback has reached the 50% Fibonacci retracement level of $0.37, which is likely to attract buying interest.
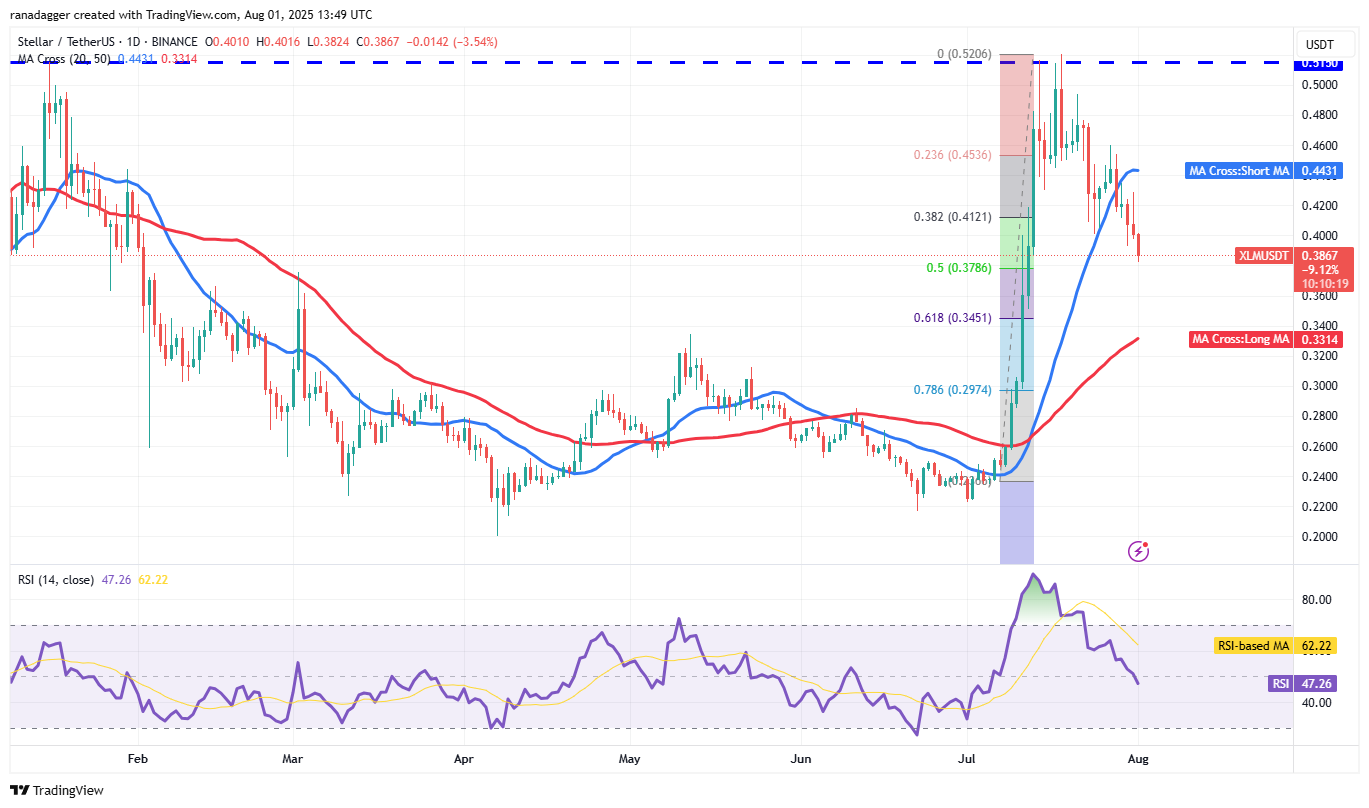
A bounce from the current level is expected to face selling at the 20-day SMA ($0.44). Should the price retract from the 20-day SMA, the risk of dropping to the 61.8% retracement level of $0.34 increases.
The first sign of strength will be a break and close above the 20-day SMA, which would open the path to retest the $0.52 level, where sellers are anticipated to engage. A sharp decline from $0.52 could push the XLM/USDT pair into consolidation.
Sui price prediction
Buyers managed to push Sui (SUI) above the 20-day SMA ($3.86) on Thursday, but the long wick on the candlestick shows that bears resisted at higher levels.
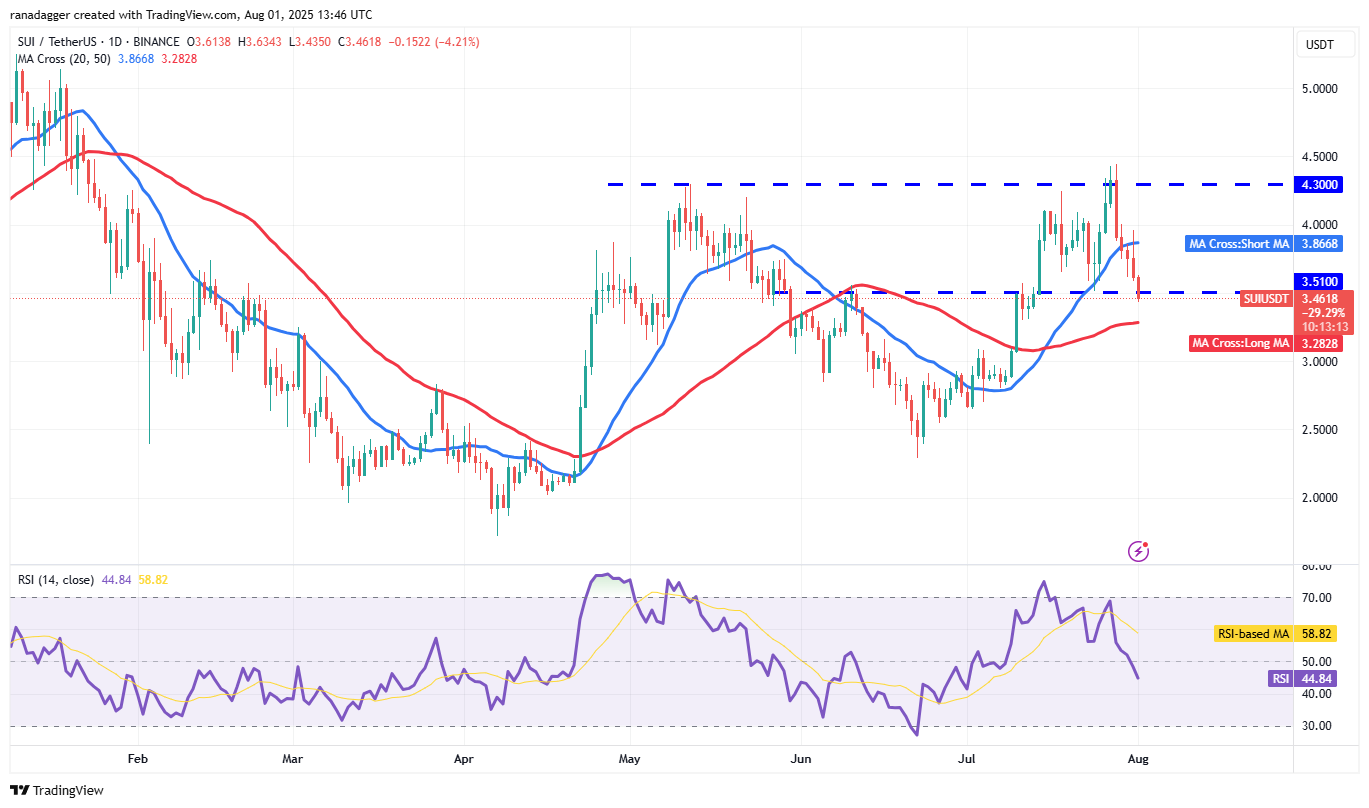
Bears are attempting to fortify their position by keeping the price below $3.51. If successful, the SUI/USDT pair might fall to the 50-day SMA ($3.28).
If the price sharpens upward and sustains above $3.51, it would suggest consistent demand at lower levels, potentially keeping the pair within the range of $3.51 to $4.44 for a while. Buyers will need to push and maintain the price above $4.44 to signal the initiation of the next uptrend toward $5.37.
This article does not constitute investment advice or recommendations. All investments and trading activities involve risks, and readers should perform their own research before making decisions.