Key points:
-
Bitcoin is trading within a narrow range, signaling a potential breakout in the coming days.
-
In Ether, buyers remain resilient against bears, indicating a sustained rally may continue.
Bitcoin (BTC) has remained within a limited range of $112,000 to $115,720 for several days, reflecting uncertainty between bulls and bears regarding the upcoming directional shift.
Analysts from Bitfinex noted that BTC’s weakness, coupled with declines in most altcoins, points to a dwindling “speculative appetite.” They anticipate the cryptocurrency market entering a consolidation phase but mention that new macroeconomic developments or increased inflows into crypto exchange-traded funds could influence future movements.
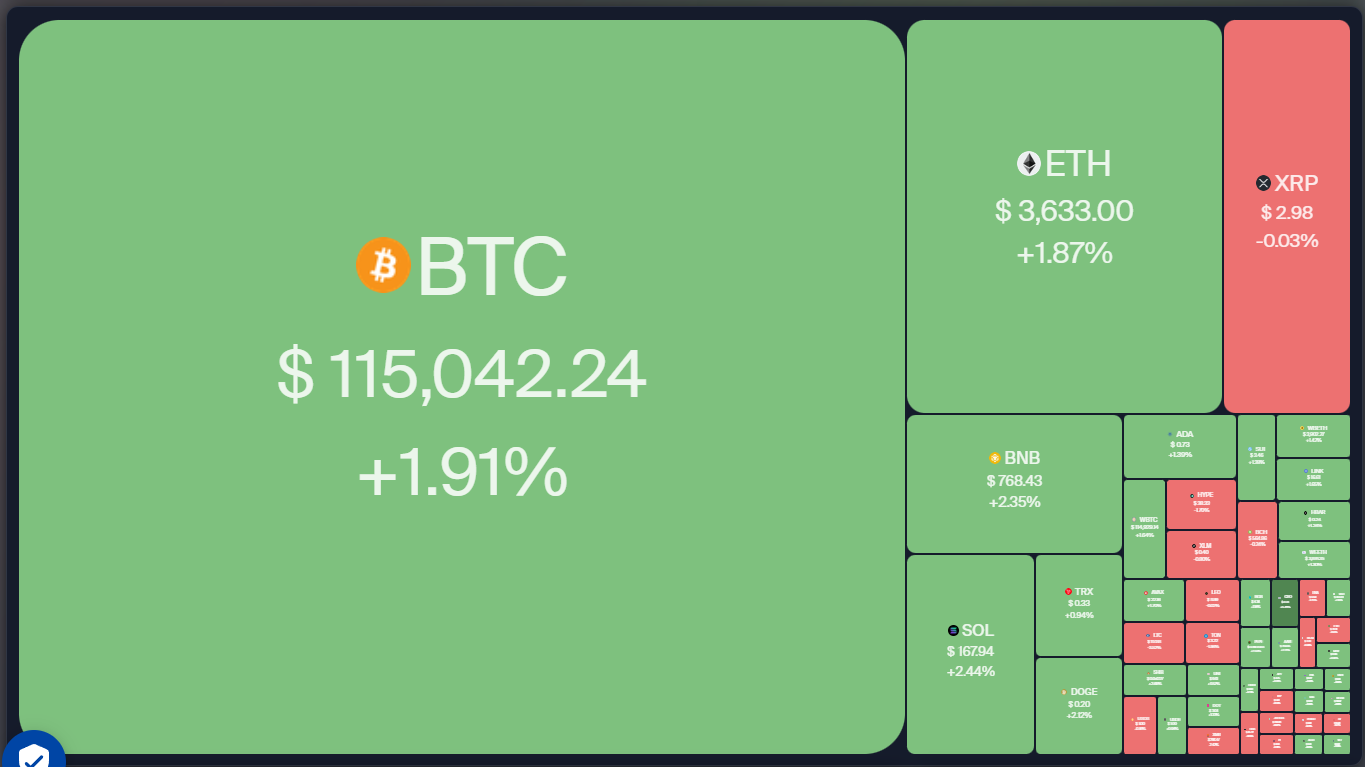
While some analysts express caution regarding BTC’s short-term price movements, Tom Lee, co-founder of Fundstrat and Chairman of BitMine, remains optimistic. In a discussion on the Coin Stories podcast, he suggested BTC could potentially rise to $200,000 or even $250,000 by year-end.
Will BTC manage to break free from its tight range? Can altcoins rally alongside BTC? Let’s delve into the charts of the top 10 cryptocurrencies to explore further.
Bitcoin price prediction
On Tuesday, BTC rebounded from the 50-day simple moving average (SMA) ($112,619), showing that bulls are actively defending this level.
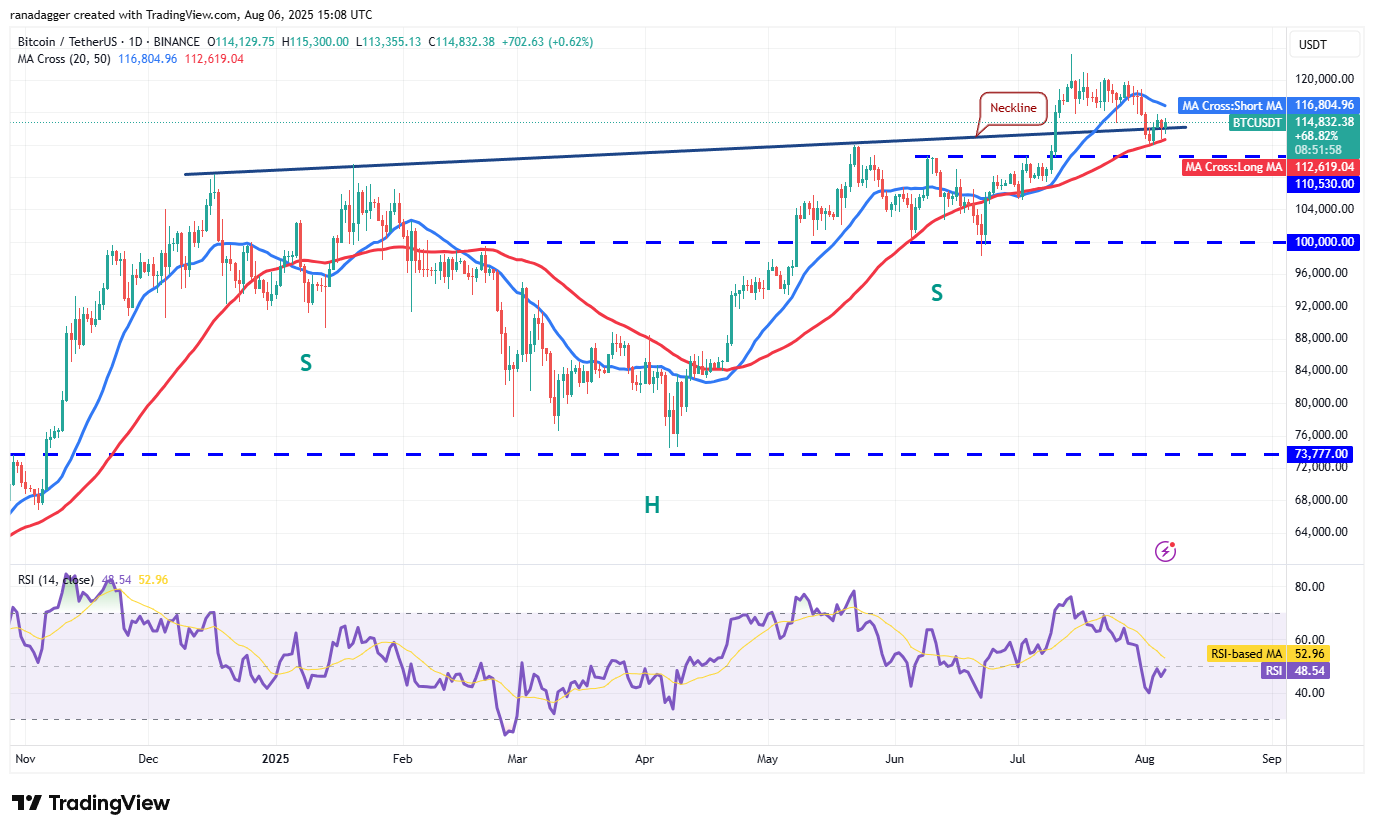
The anticipated rally may encounter resistance at the 20-day SMA ($116,804), which is trending downwards. If this occurs, the BTC/USDT pair might remain constrained between the moving averages for a while.
If buyers succeed in maintaining the price above the 20-day SMA, they could challenge the resistance at $120,000 and aim for the all-time high of $123,218.
Conversely, if the price drops below the 50-day SMA, it could lead to a decline towards $105,000, and then to $100,000. A support level exists at $110,530, but it may likely be breached.
Ether price prediction
On Monday, buyers drove Ether (ETH) above the 20-day SMA ($3,675) but were unable to surpass the resistance at $3,745.
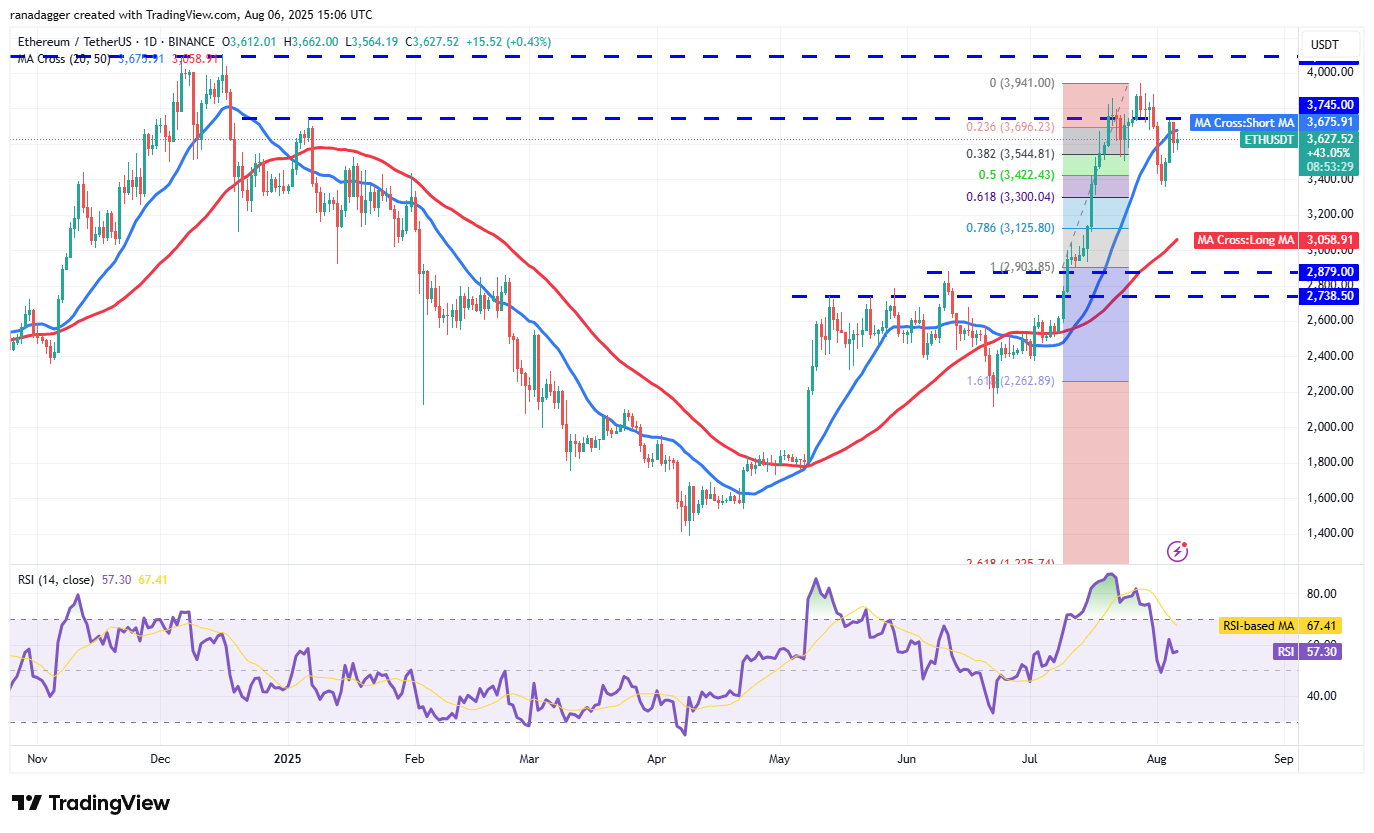
A positive sign is that bulls have not given much ground to bears, suggesting they anticipate another upward movement. If the price clears the $3,745 level, the ETH/USDT pair could rise to $3,941 and potentially reach $4,094.
This optimistic outlook would be negated if the price declines below the 61.8% Fibonacci retracement level of $3,300, which could lead to a drop to the 50-day SMA ($3,058).
XRP price prediction
XRP (XRP) rebounded from the 50-day SMA ($2.69) on Sunday but is facing selling pressure near the 20-day SMA ($3.16).
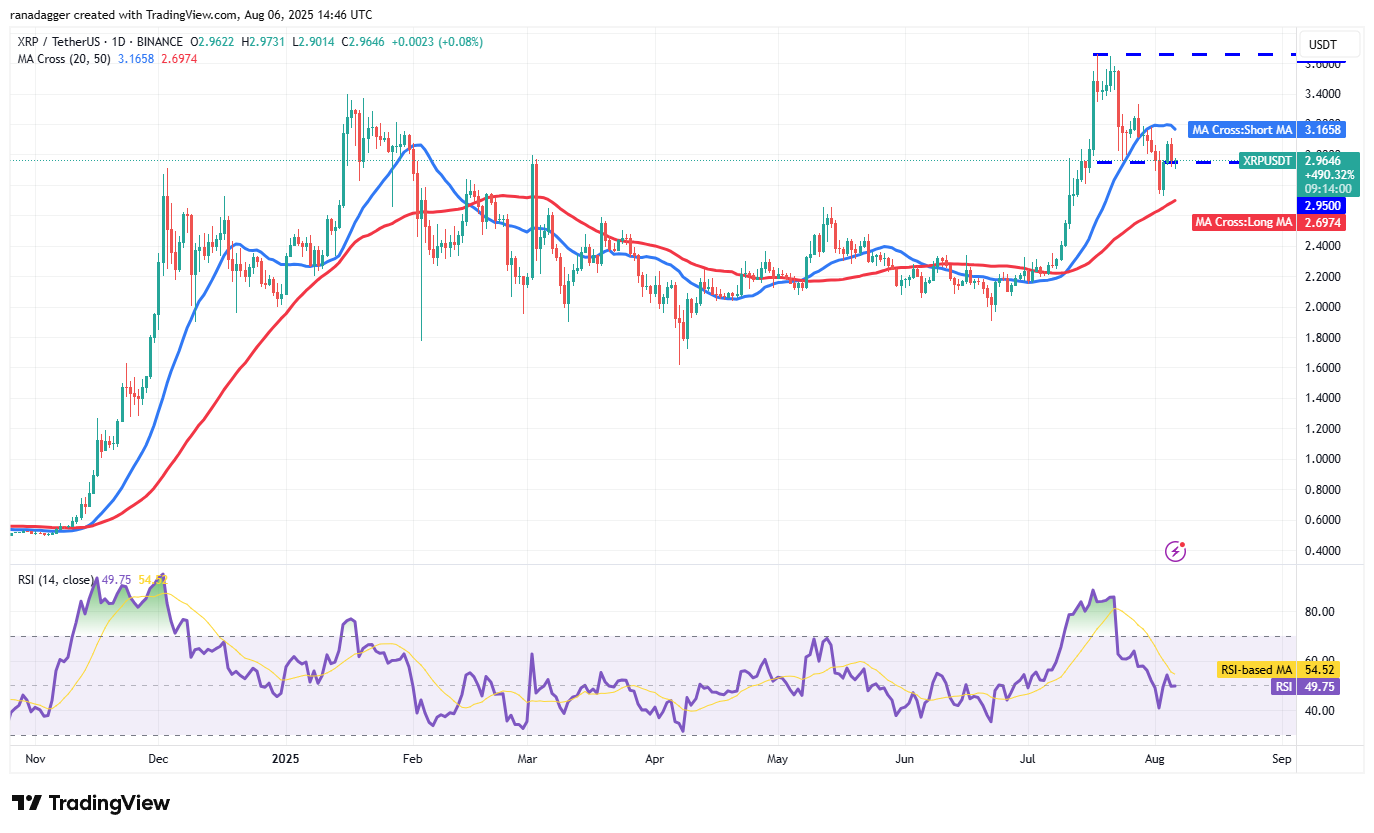
This suggests that while bulls are buying on dips, bears are selling on rallies, which may keep the XRP/USDT pair trapped between the moving averages for a time.
For buyers to regain momentum, they must push the price above the 20-day SMA, which could see the pair rise to $3.33 and eventually to $3.66.
Alternatively, a decline below the 50-day SMA would indicate bulls are losing their grip, potentially triggering a drop to $2.40.
BNB price prediction
BNB’s (BNB) recent relief rally is encountering resistance at the 20-day SMA ($774), although buyers continue to exert pressure.
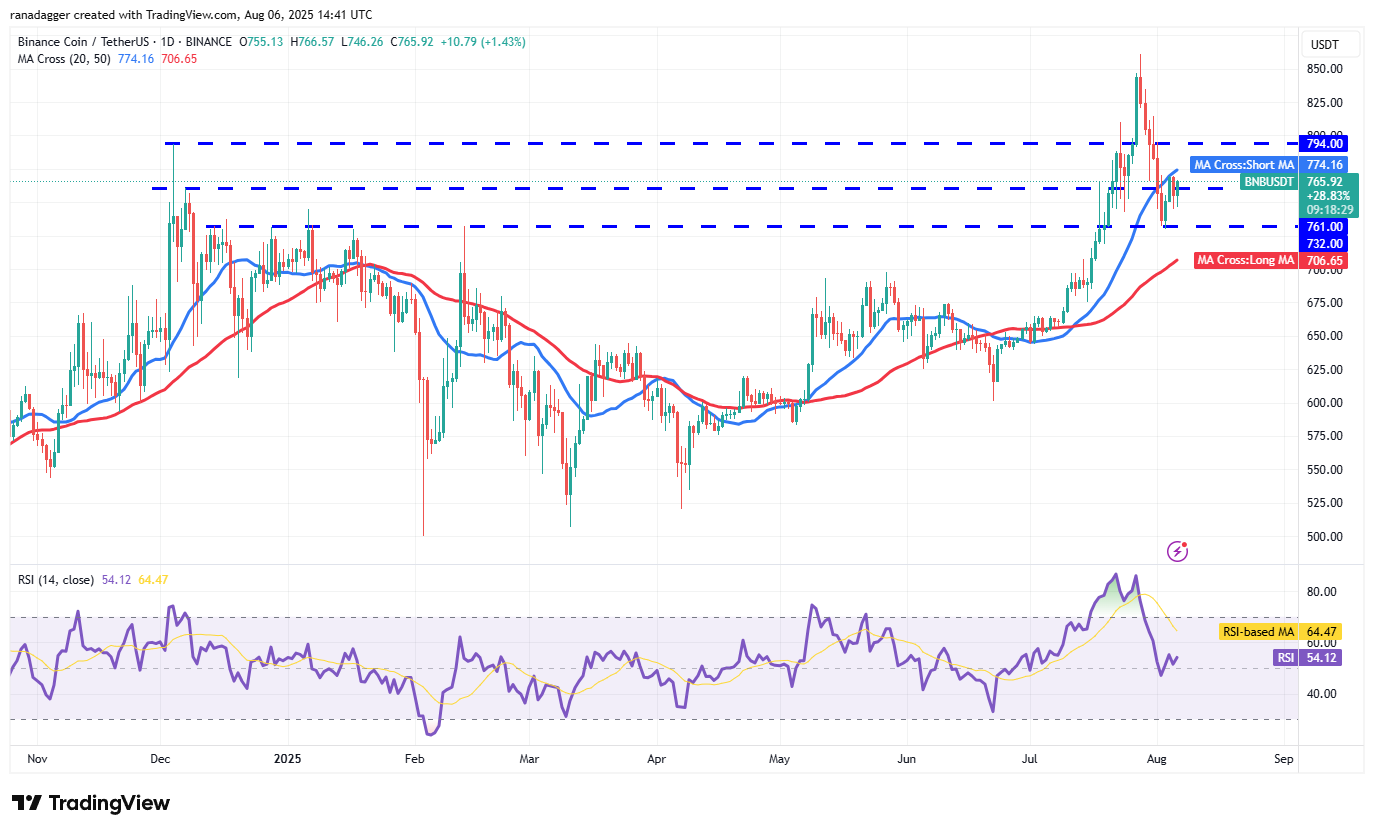
If the price clears the 20-day SMA, the BNB/USDT pair may rise to $794. If sellers attempt to halt this upward movement at $794, a rally could ensue, leading to $815 and then $861.
On the other hand, a sharp decline from the 20-day SMA would indicate strong resistance from bears, increasing the likelihood of breaking below the $732 support. Such a move could bring the price down to the 50-day SMA ($706).
Solana price prediction
Solana (SOL) has once again dipped to the 50-day SMA ($162), indicating selling pressure on relief rallies.
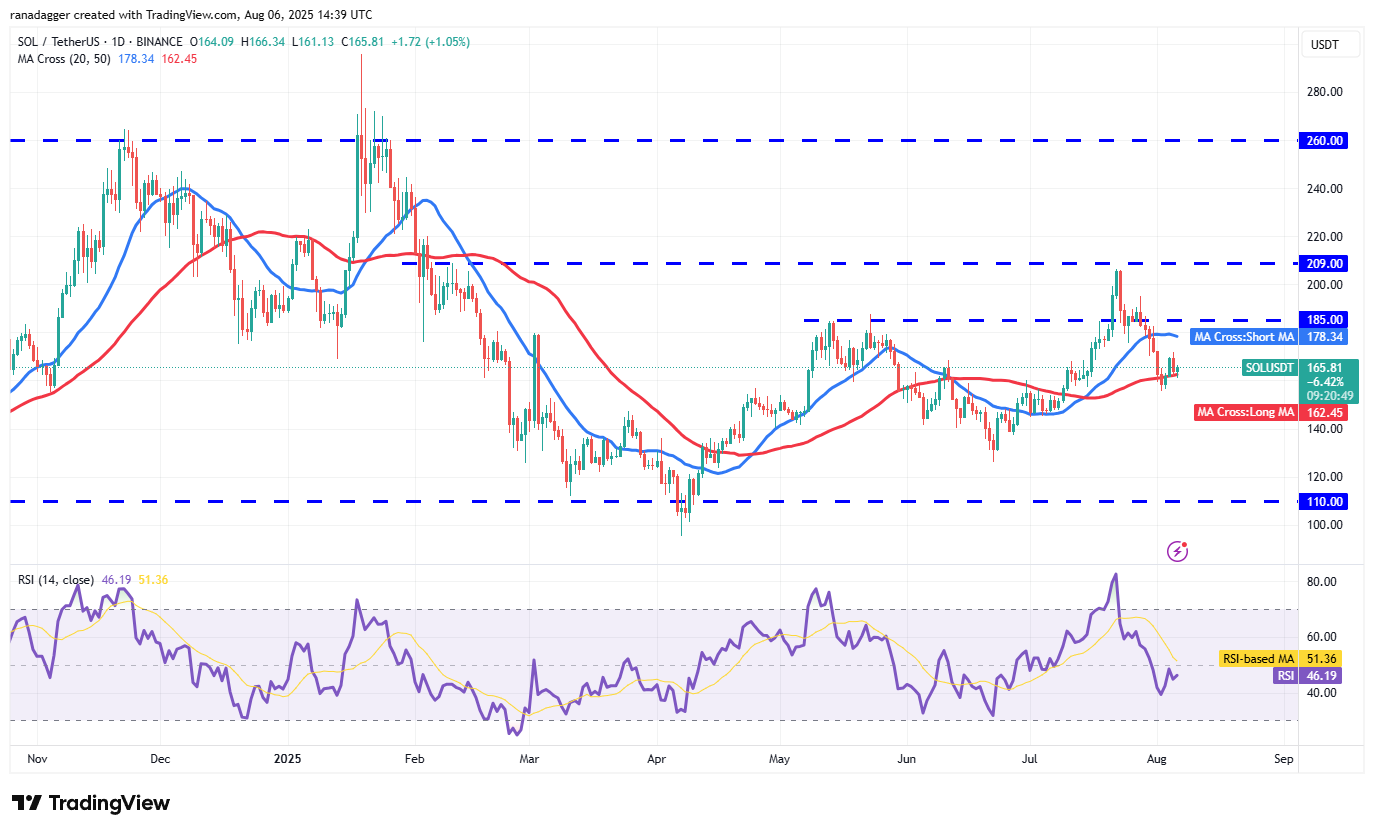
The flat moving averages and RSI near the midpoint suggest no clear advantage for either bulls or bears. Should the price bounce off the 50-day SMA with vigor, the SOL/USDT pair could rise to the 20-day SMA ($178).
Bulls would gain an edge if the price surpasses $185, opening the way for a retest of significant resistance at $209. Conversely, a drop below $155 could see the pair fall to $144 and potentially to $137.
Dogecoin price prediction
Buyers have successfully defended the 50-day SMA ($0.19) but are having difficulty pushing Dogecoin (DOGE) past the $0.21 resistance.
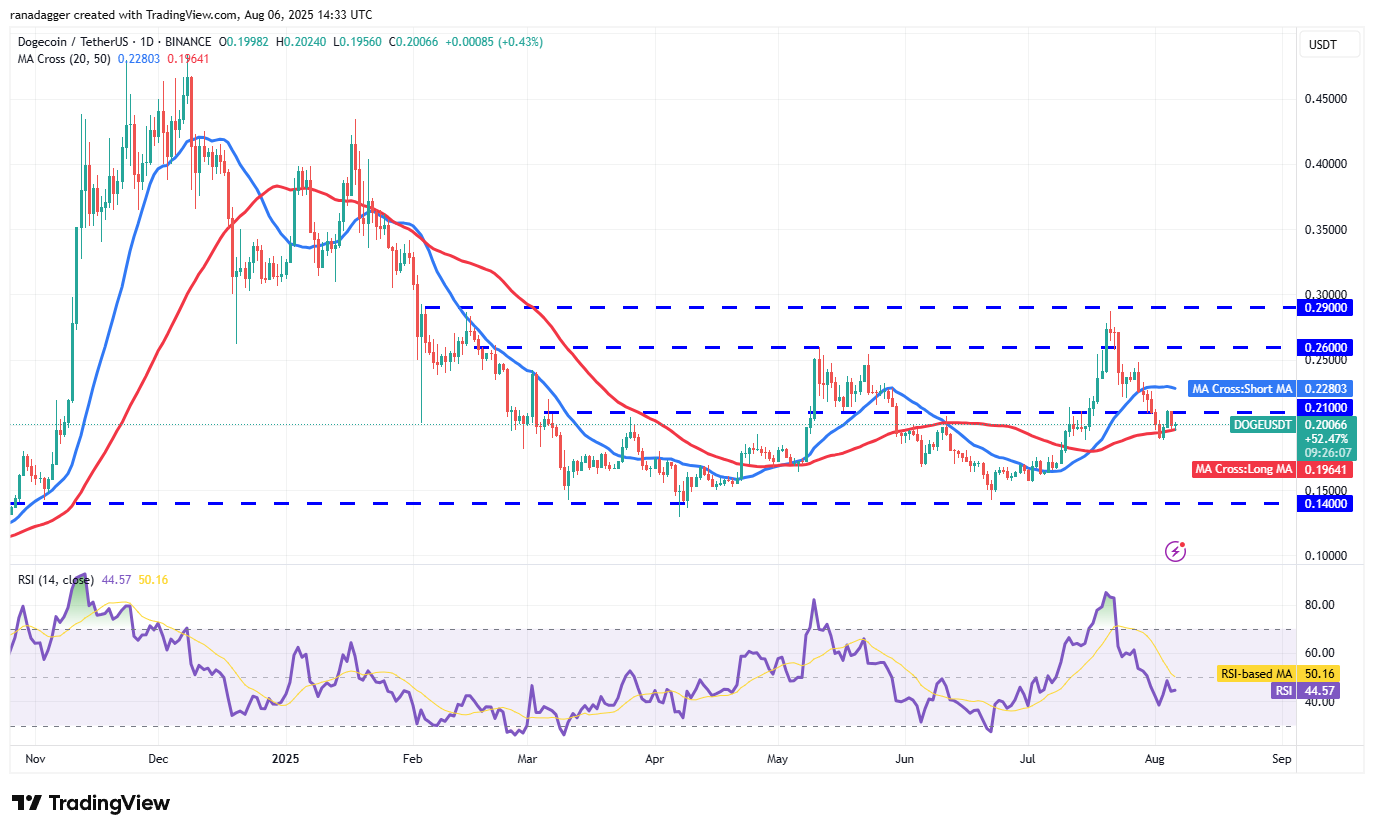
Both moving averages have plateaued, and the relative strength index (RSI) just under the midpoint suggests a period of range-bound movement ahead.
If the price rises and breaks above $0.21, the DOGE/USDT pair could move to the 20-day SMA ($0.22). Sellers are likely to defend the 20-day SMA, which may keep the pair boxed between the moving averages for a while.
Related: Bitcoin supply shock to ‘uncork’ BTC price as OTC desks run dry
If bulls fail to protect the 50-day SMA, DOGE could fall to $0.17 and then to the solid support level at $0.14.
Cardano price prediction
Cardano (ADA) bounced from the 50-day SMA ($0.68) on Sunday, but the relief rally is facing pressure at $0.76.
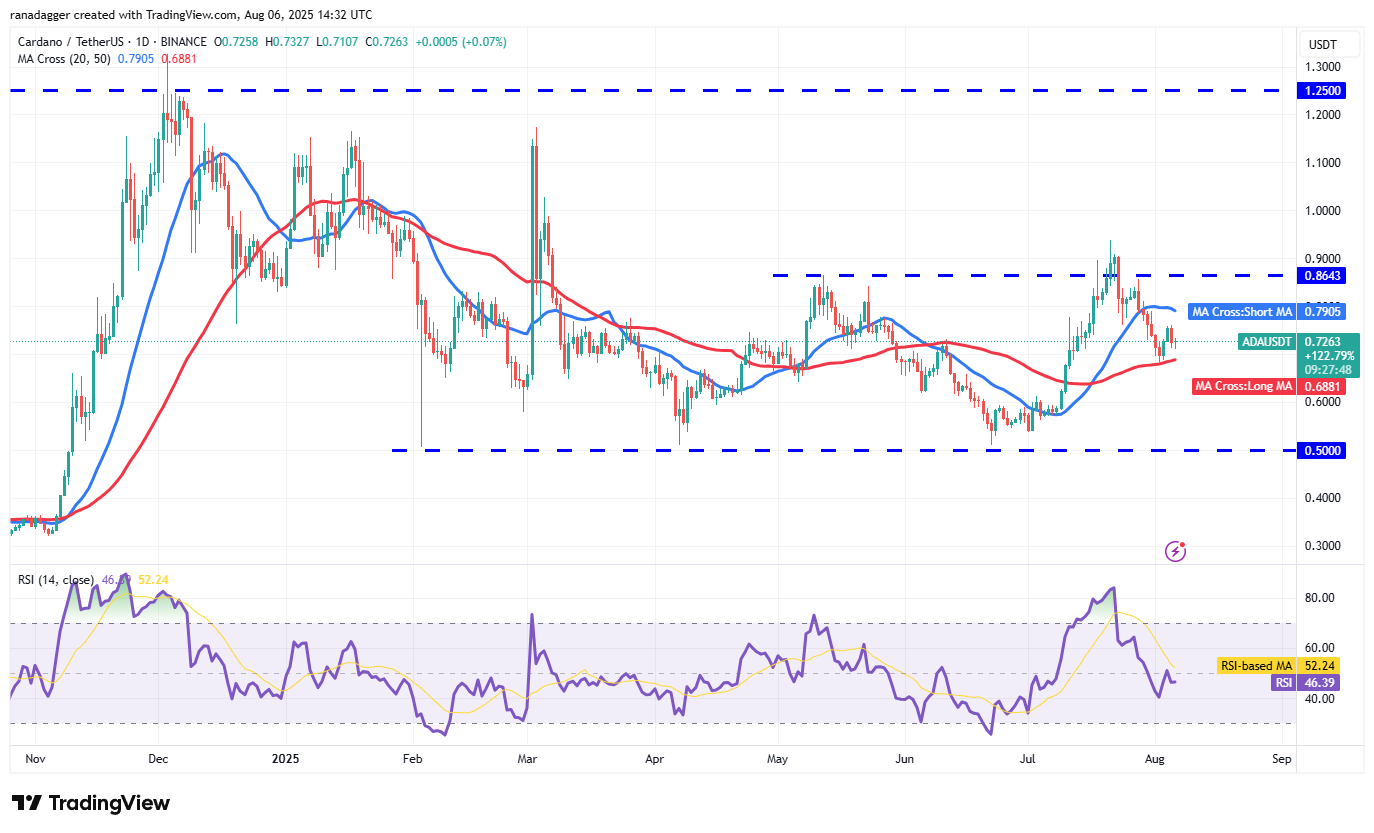
Flat moving averages and RSI below the midpoint suggest the ADA/USDT pair may fluctuate between the moving averages in the coming days.
Sellers will take control if they push the price below the 50-day SMA, which could lead to a drop towards $0.56. Conversely, if the price exceeds the 20-day SMA ($0.79), it could rise towards $0.86.
Hyperliquid price prediction
Hyperliquid’s (HYPE) relief attempt from $35.51 waned near the 50-day SMA ($40.99), indicating a shift toward bearish sentiment as traders sell on rallies.
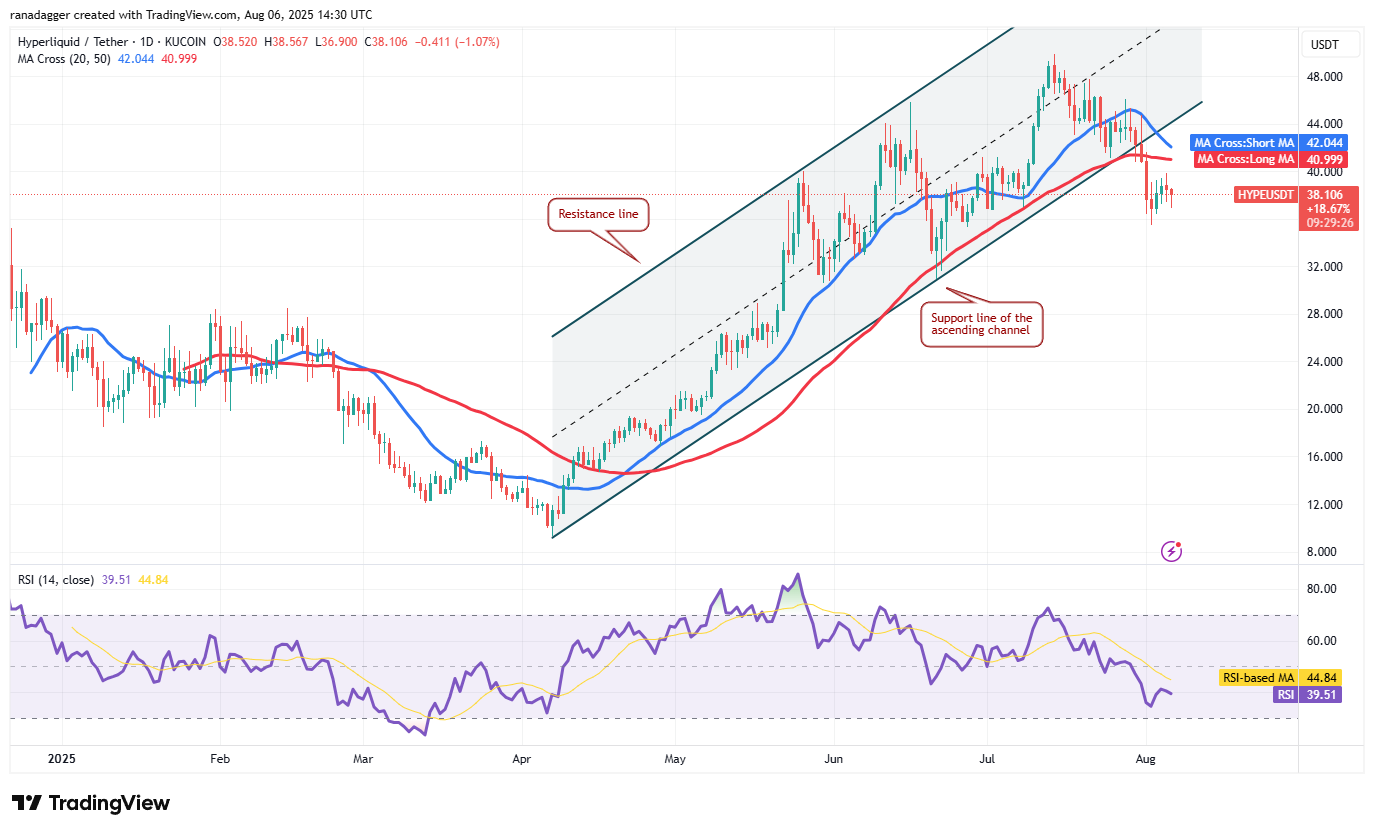
The impending bearish crossover of the moving averages and the RSI in negative territory suggest that bears could be gaining control. Should the price fall below $35.50, the HYPE/USDT pair might drop to $32.
During any rebounds, sellers are predicted to guard the area between the 50-day SMA and the channel support line. Buyers will need to push the HYPE price back into the channel to indicate that the corrective phase may have concluded.
Stellar price prediction
Stellar (XLM) declined from the 20-day SMA ($0.42) on Monday, indicating that bears continue to sell on rallies.
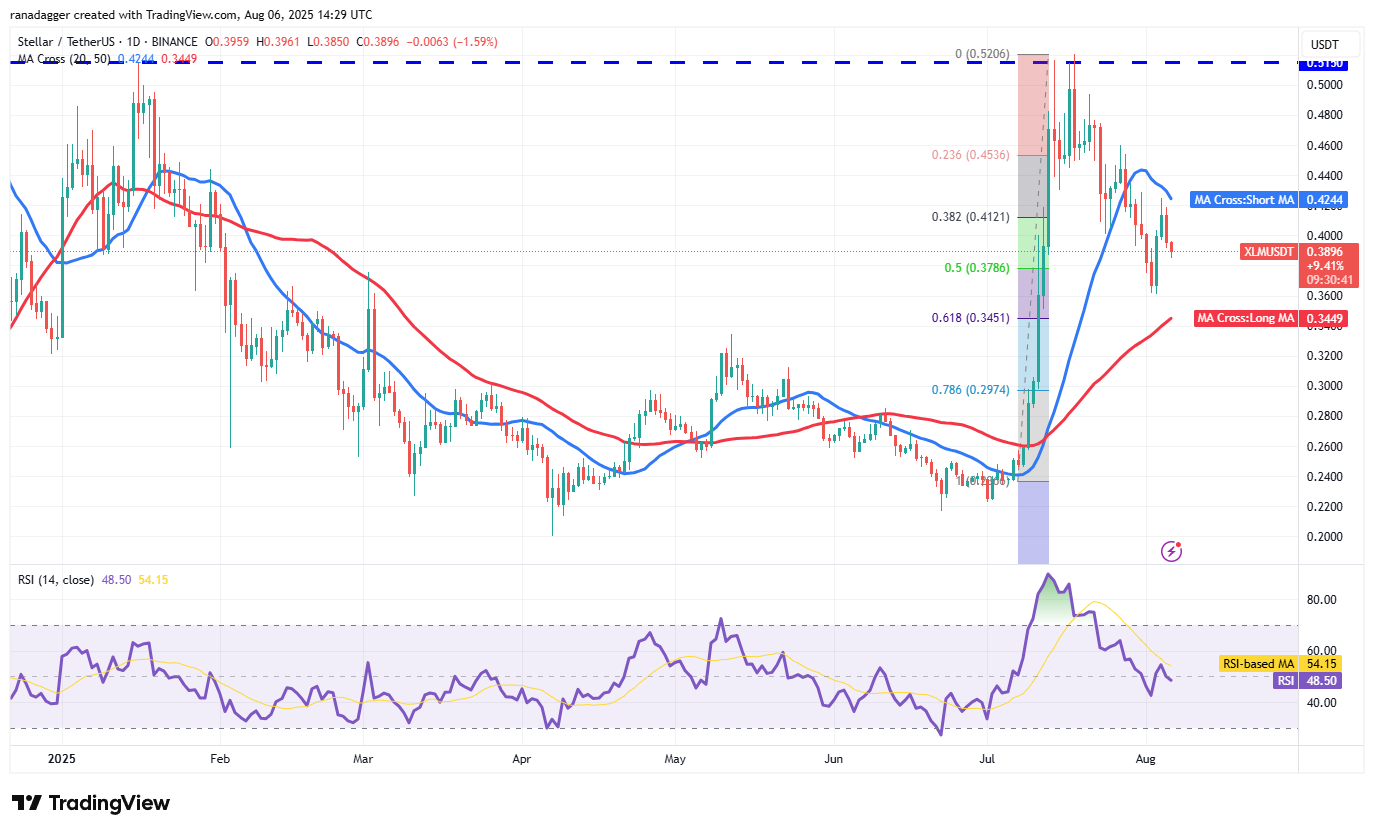
The XLM/USDT pair may fall to the 50-day SMA ($0.34), likely attracting buying interest. A rebound from this level could keep the pair confined between the moving averages.
A significant movement is expected to occur either above the 20-day SMA or below the 50-day SMA. An advance above the 20-day SMA would signal the end of the correction, while a drop below the 50-day SMA might push the XLM price down to $0.29.
Sui price prediction
Sui (SUI) has retraced to the 50-day SMA ($3.32), indicating continued pressure from bears.
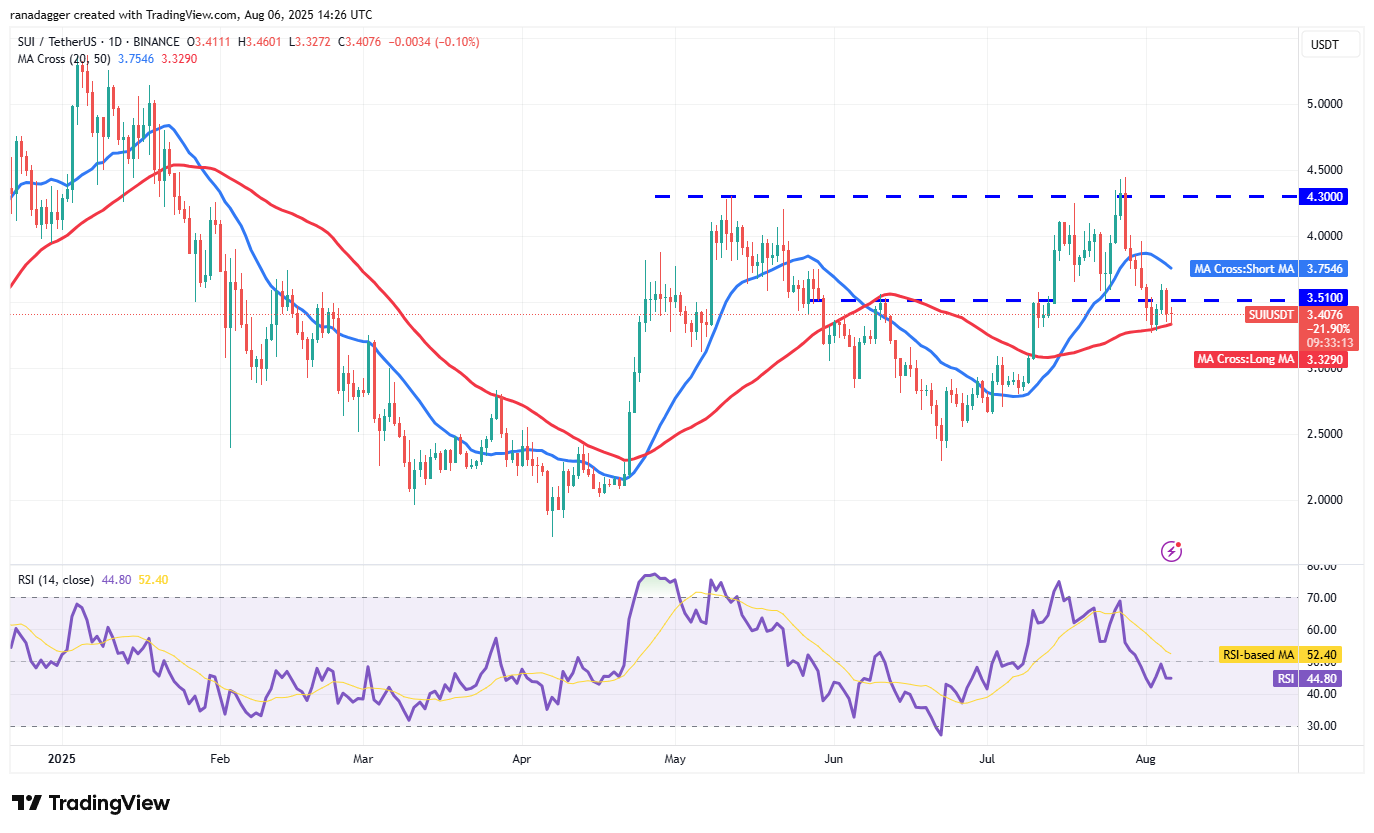
The 20-day SMA ($3.75) is beginning to decline, and the RSI is below 45, suggesting a slight advantage for bears. On any bounce, sellers are expected to defend the 20-day SMA. If the price falters at this level, the chances of breaching the 50-day SMA increase. The SUI/USDT pair could then decline to $2.87 and potentially to $2.65.
For buyers to avert further downside, they need to push the price above the 20-day SMA. Success in this would allow SUI to initiate a rally towards $4 and eventually test the overhead resistance at $4.30.
This article does not contain investment advice or recommendations. Every investment and trading move involves risk, and readers should conduct their own research before making decisions.