Key points:
-
Bitcoin has retraced into the $115,000 to $110,530 support zone, where it is expected that buyers will defend strongly.
-
ETH has been hovering near the resistance as investors continue to invest in spot ETH ETFs.
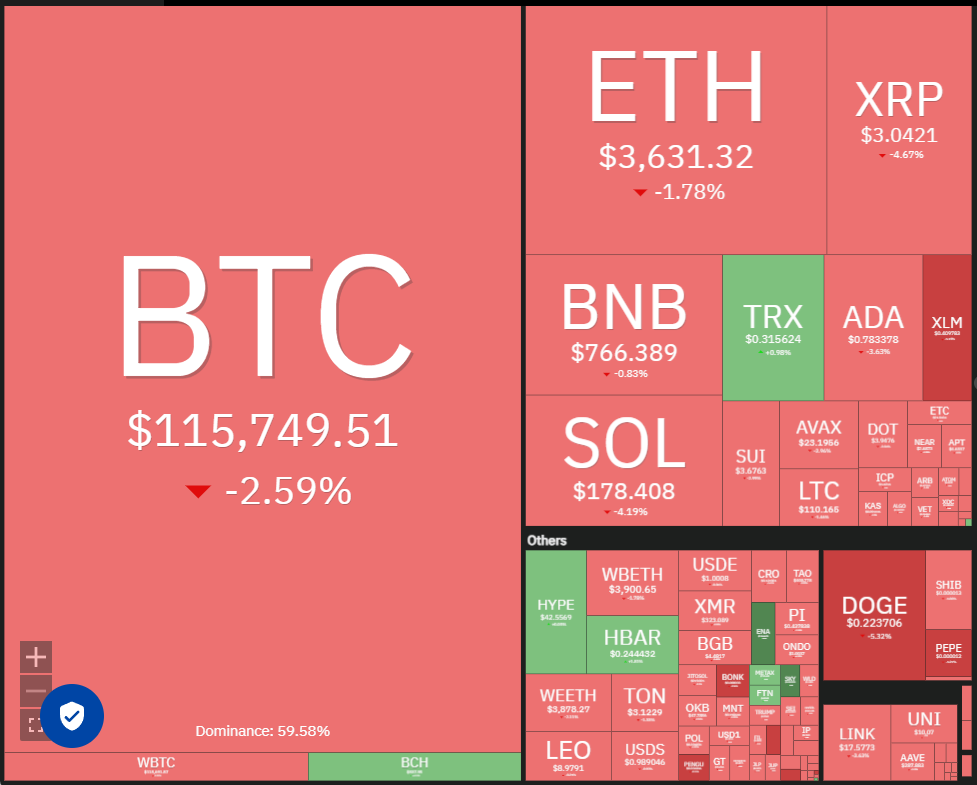
The recent inability of Bitcoin (BTC) to stay above the $120,000 mark may have encouraged short-term traders to take profits, leading to a drop below the $115,000 threshold on Friday.
This consolidation phase for BTC appears to be redirecting investor focus to Ether (ETH), suggesting a shift in capital, based on new research shared on X by crypto market insights firm Swissblock.
Data from Farside Investors shows that spot ETH exchange-traded funds (ETFs) have seen net inflows of approximately $2.4 billion over the last six trading days, significantly outpacing the $827 million net inflows into spot BTC ETFs during the same timeframe.
Michael Novogratz, CEO of Galaxy Digital, mentioned on CNBC that ETH is likely to “outperform Bitcoin in the next three to six months.” He also noted that ETH could enter a price discovery phase if it surpasses $4,000.
BitMEX co-founder Arthur Hayes has an even more optimistic view, forecasting ETH could reach $10,000 by year-end.
What are the key support and resistance levels to monitor for BTC and major altcoins? Let’s examine the charts of the top 10 cryptocurrencies for insights.
Bitcoin price prediction
BTC has fallen below the 20-day simple moving average (SMA) ($116,305), signaling that sellers are making a comeback.
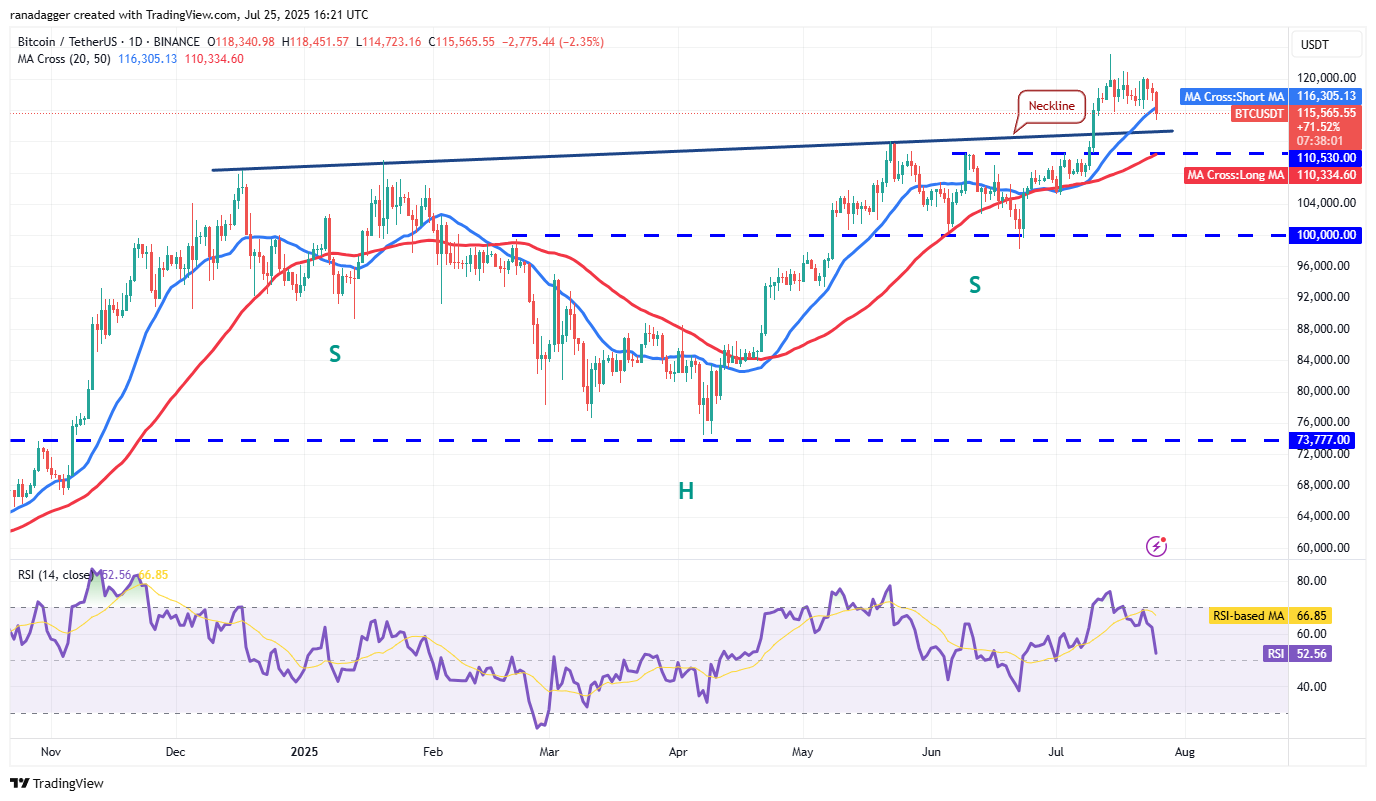
Nevertheless, bulls are expected to vigorously defend the area between the 20-day SMA and the $110,530 support level. A sharp rebound from this support zone would indicate ongoing positive sentiment as traders buy on dips, potentially leading to a breakout above $123,218. If realized, the BTC/USDT pair could surge to $135,729.
This optimistic outlook could change if the price continues to decline and falls below $110,530, which could intensify selling pressure and push the pair toward the critical $100,000 support level.
Ether price prediction
ETH faces significant resistance around the $3,745 mark, but the bulls have shown resilience against the bears.
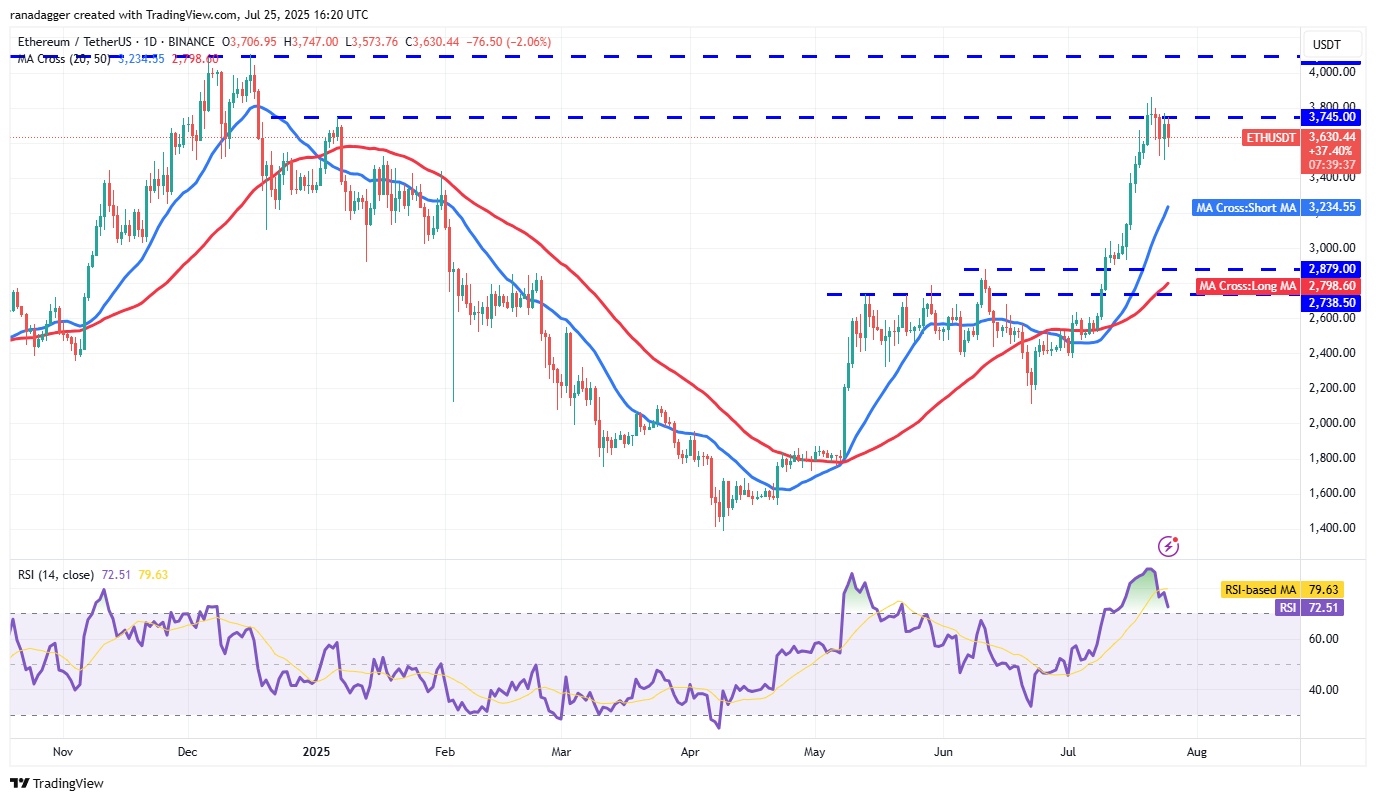
Consolidation near strong resistance increases the chances of a breakout. If that occurs, the ETH/USDT pair could test the overhead resistance at $4,094, and closing above this level might initiate a new upward trend towards $4,868.
The initial downside support is at $3,500. A close below $3,500 could expose the pair to a drop toward the 20-day SMA ($3,234). Buyers are anticipated to defend this SMA vigorously, as falling below it would favor the bears.
XRP price prediction
Buyers attempted to push XRP (XRP) above the $3.66 resistance on Monday, but bears maintained their position.
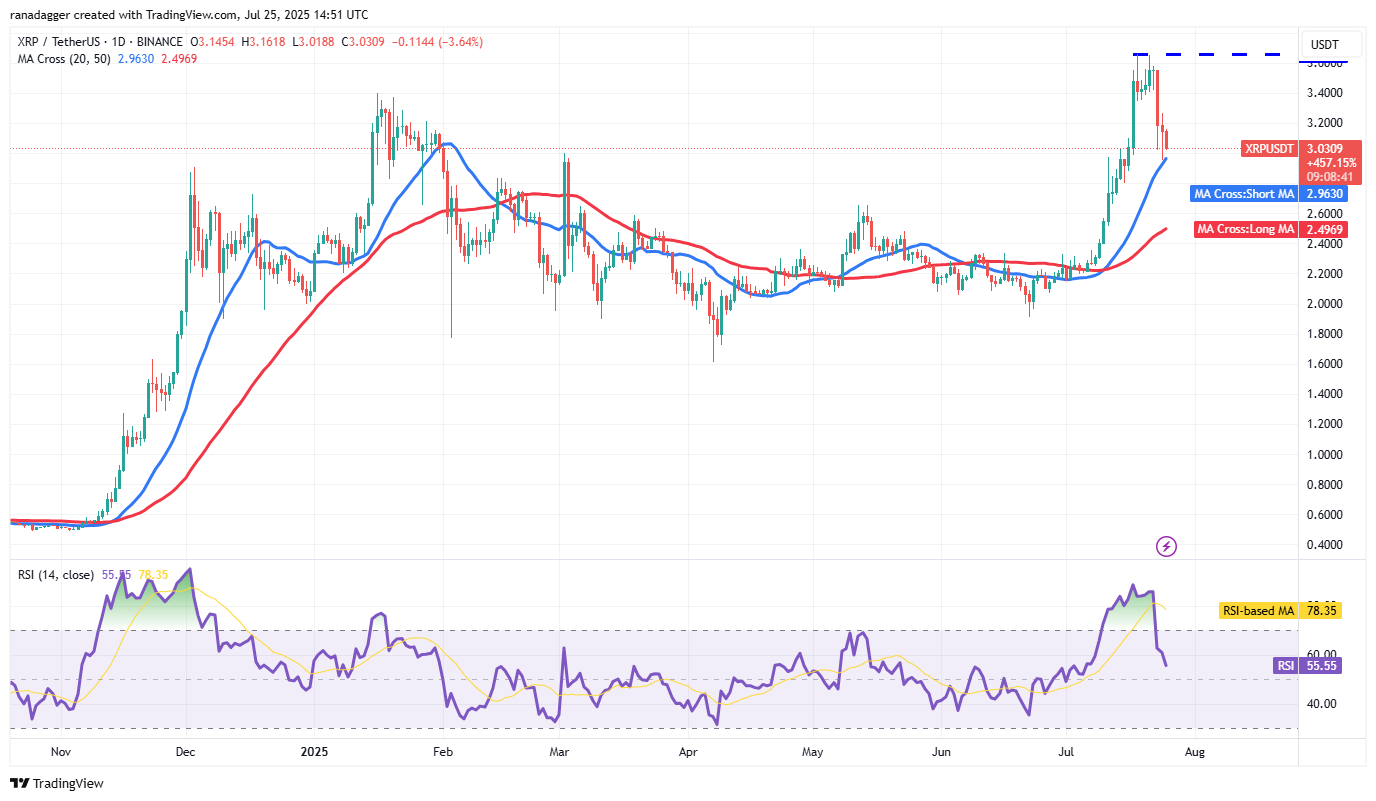
The failure to resume an uptrend may have led short-term traders to take profits, resulting in a price drop to the 20-day SMA ($2.96), which is expected to act as strong support. If the price bounces off the 20-day SMA with vigor, bulls will have another chance to push the XRP/USDT pair above $3.66. Success could see the pair rise to $4 and subsequently $4.50.
Conversely, a drop and close below the 20-day SMA may trigger a deeper correction to $2.60.
BNB price prediction
BNB (BNB) reached an all-time high of $809 on Wednesday, but bulls struggled to maintain those levels.
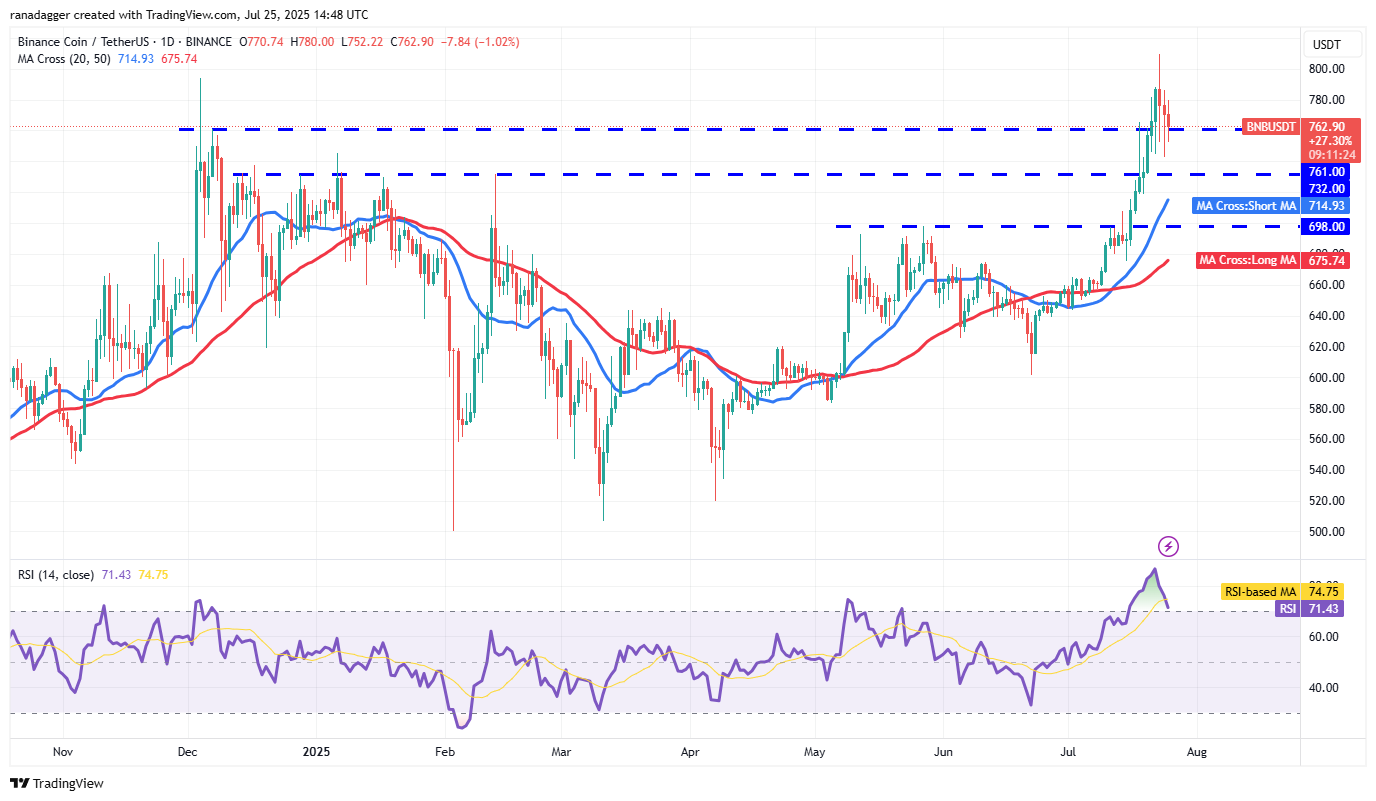
The current pullback is finding support in the $761 to $732 range. A mild pullback indicates that bulls are not rushing to take profits, anticipating an upcoming rally. If the price rebounds from its current point and breaks above $809, the BNB/USDT pair could lead to a jump towards $900.
Sellers will need to consistently keep prices below the 20-day SMA ($714) to thwart any upward momentum, suggesting that the breakout above $794 may have been a bull trap.
Solana price prediction
Solana (SOL) declined from the $209 resistance on Wednesday, breaking below the breakout level of $185 on Thursday.
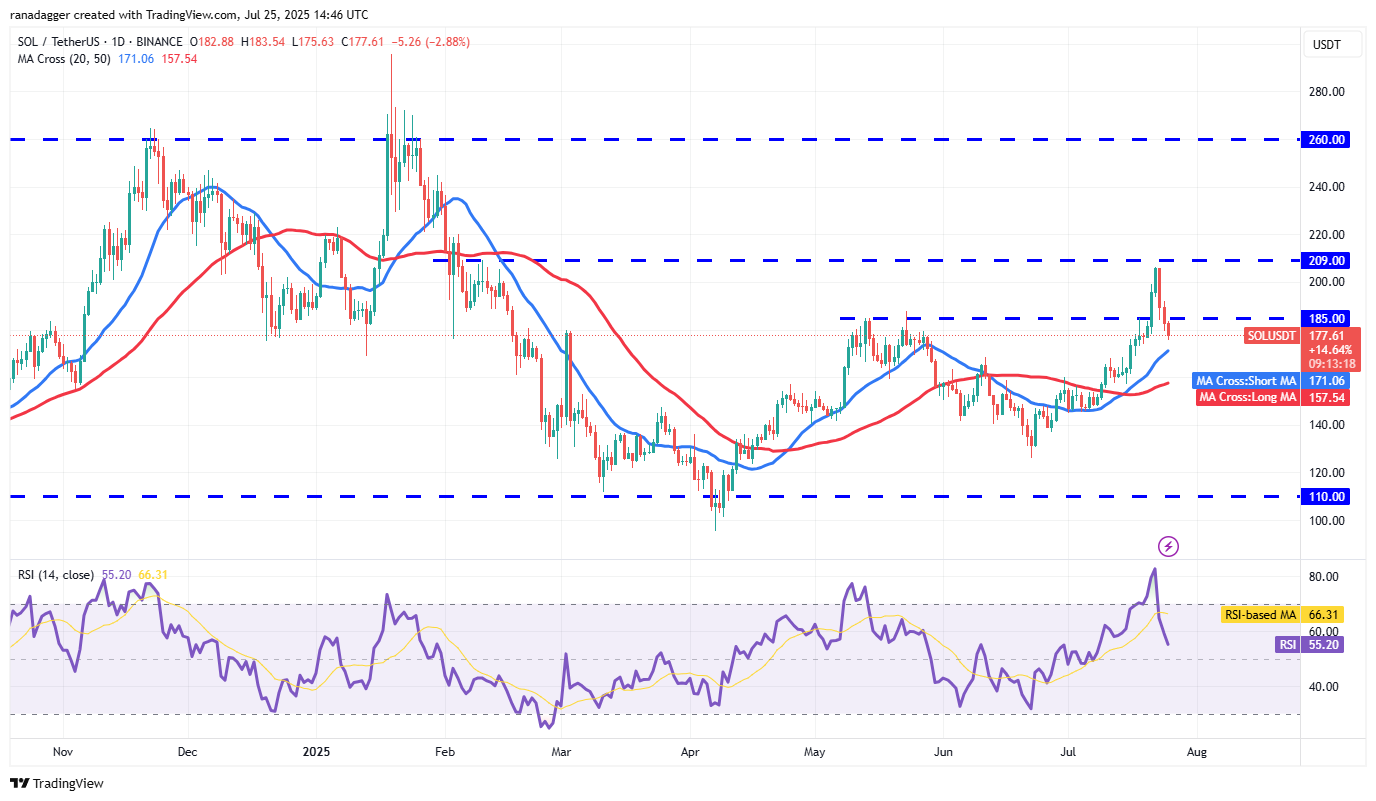
The 20-day SMA ($171) serves as strong support. A rebound from this level could see bulls attempt to push the SOL/USDT pair above $209 again. Success might lead to a rise towards $240 and eventually $260.
However, if the price falls below the 20-day SMA, it could signal that bulls are losing strength, leading the pair down to the 50-day SMA ($157) and potentially delaying the next upward move.
Dogecoin price prediction
Dogecoin (DOGE) has shifted between $0.14 and $0.29 for several days, reflecting buying on dips and selling near resistance.
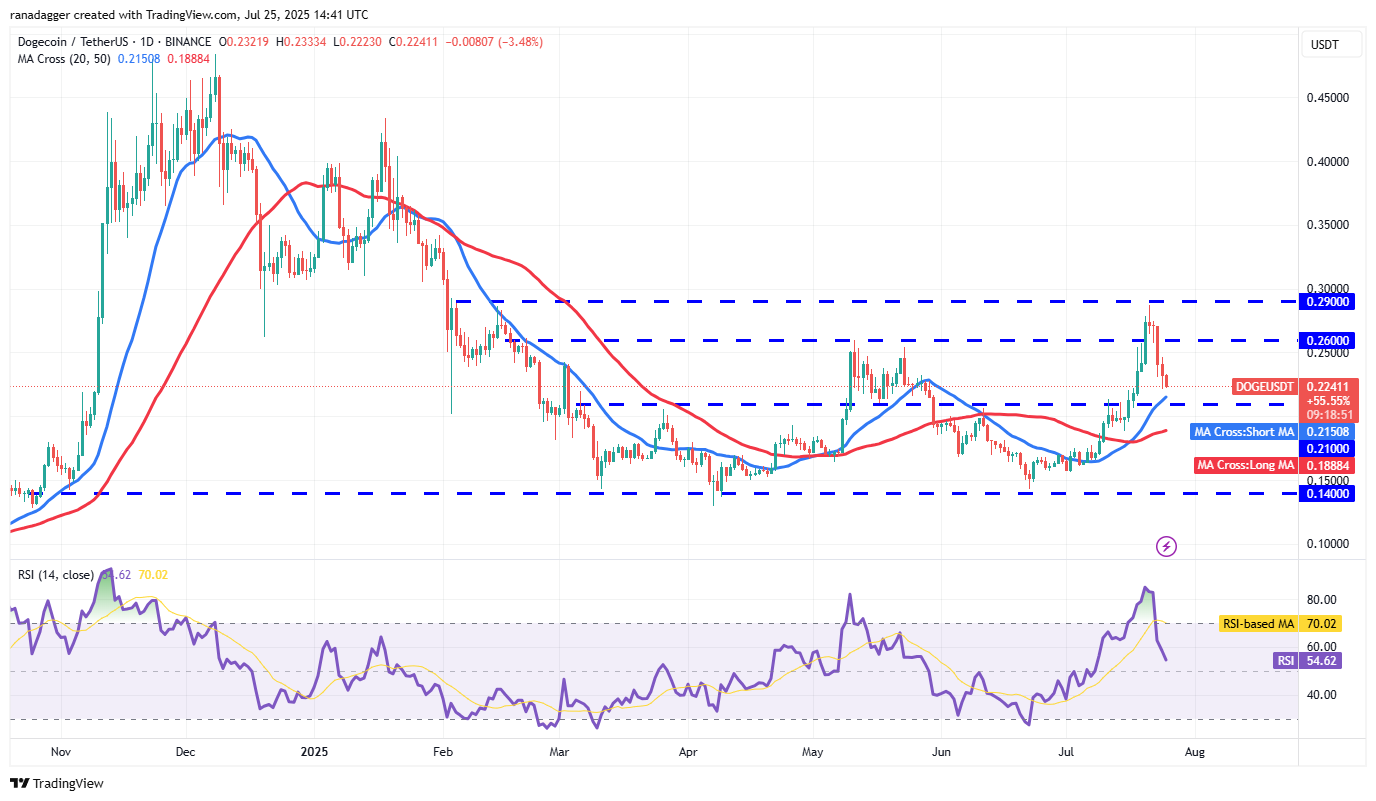
After declining from $0.29 on Monday, the price is likely to find support at the 20-day SMA ($0.21). If it bounces back, bulls could push the DOGE/USDT pair to $0.29. A break and close above $0.29 may initiate a new uptrend towards the target of $0.44.
If the price falls below the 20-day SMA, it suggests the pair may remain within a broader range for a few more days.
Cardano price prediction
Cardano (ADA) is currently supported by the 20-day SMA ($0.74), but bears are likely to sell during rallies.
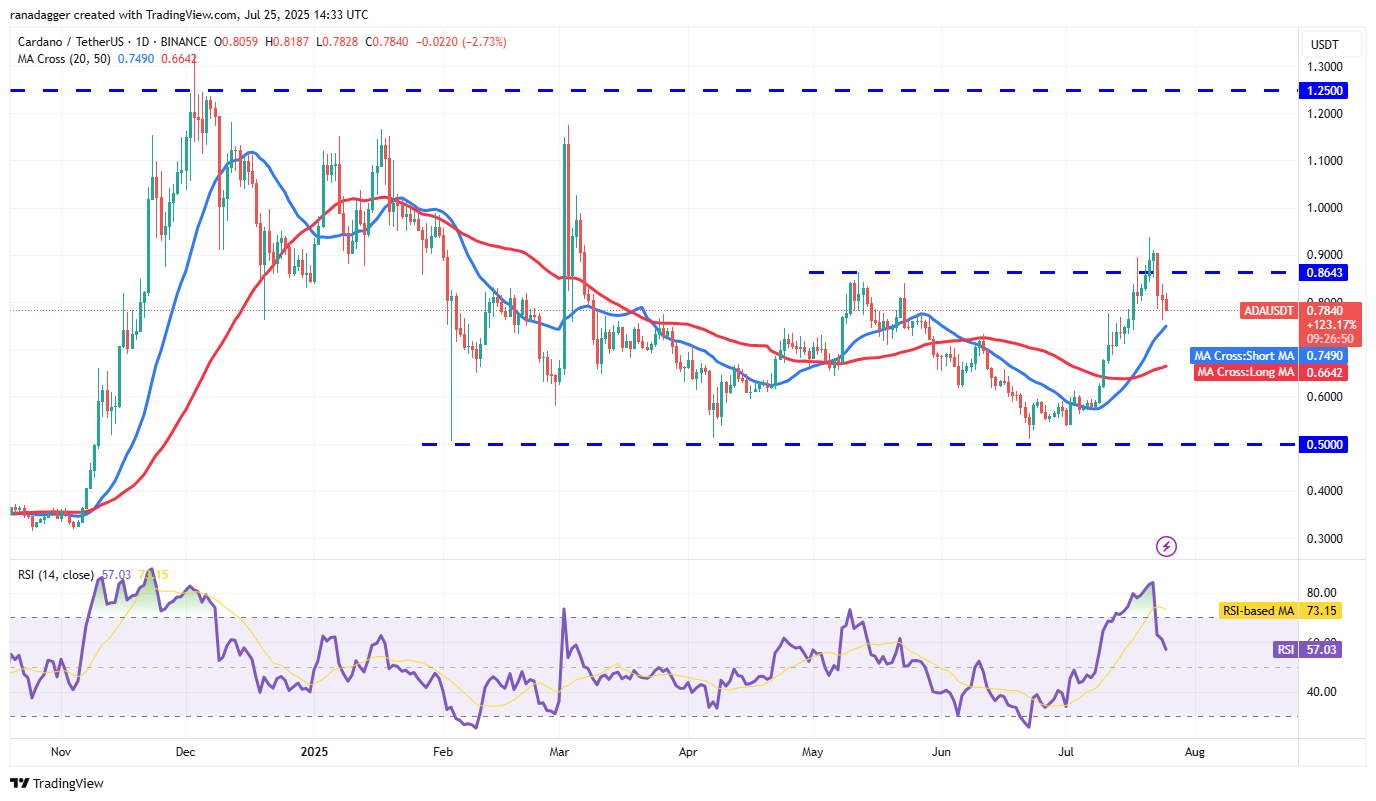
If the price declines and breaks below the 20-day SMA, it would indicate weak demand at lower levels and open the way for a decline to the 50-day SMA ($0.66).
Conversely, a rebound from the 20-day SMA would suggest strong buyer defense. The bulls would aim to push the price to $0.86 and then $0.94. While sellers are expected to guard the $0.94 level, if buyers succeed, the ADA/USDT pair could resume its upward trajectory toward $1.02 and ultimately $1.17.
Related: Eric Trump ‘agrees’ Ether should be over $8K as Global M2 money soars
Hyperliquid price prediction
Hyperliquid (HYPE) fell below the 20-day SMA ($44.29) on Wednesday and has reached the ascending channel’s support line.
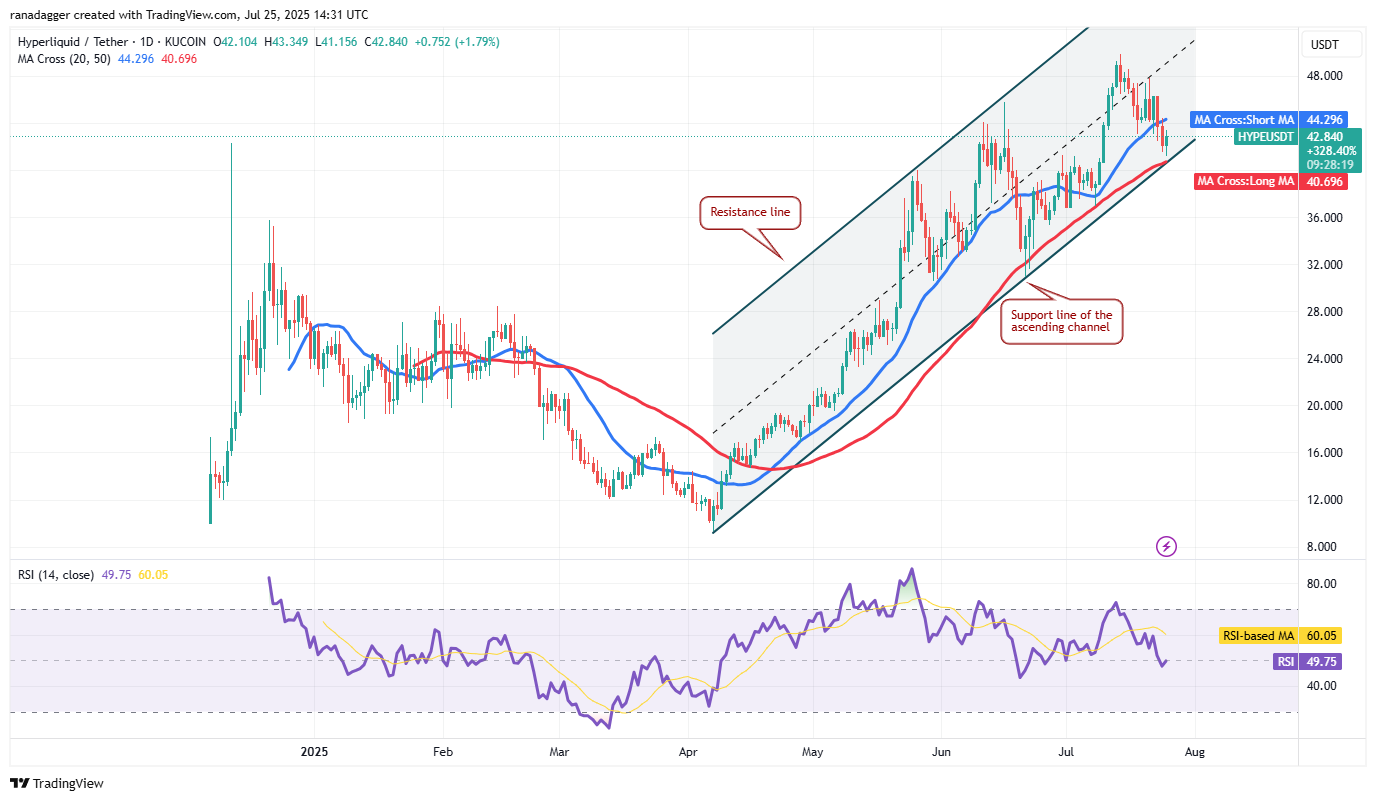
The 50-day SMA ($40.69) aligns closely with the channel’s support line, suggesting that bulls are likely to defend this level strongly. A bounce off the support and a rise above the 20-day SMA would indicate the HYPE/USDT pair may remain within the channel for a while longer, possibly climbing to $48 and then $49.87.
Conversely, a drop below the support line would indicate the start of a steeper correction, with potential declines to $36 and later $32.
Stellar price prediction
Stellar (XLM) corrected from $0.52 on July 18 and is currently at the 20-day SMA ($0.40), which is likely to attract buyers.
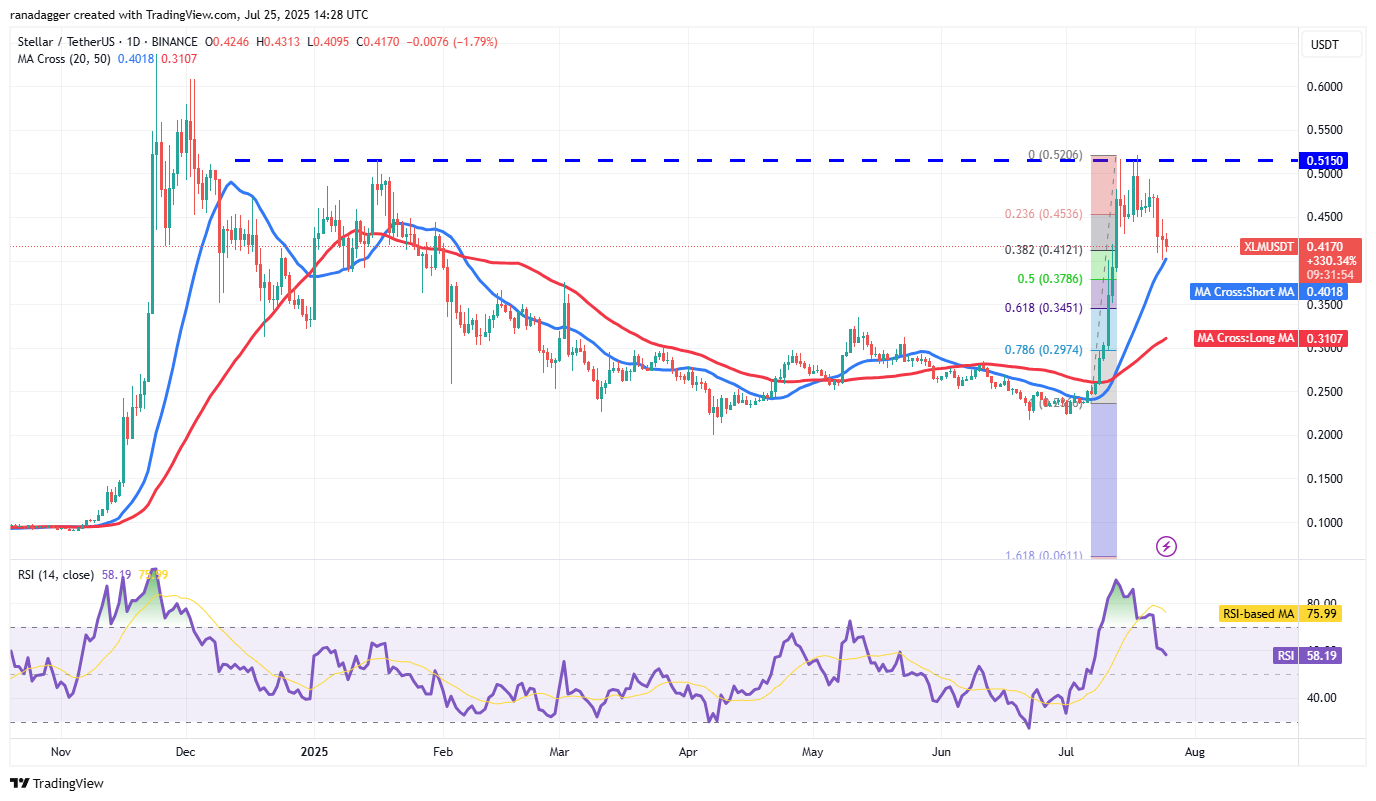
If the price rebounds from the 20-day SMA with force, bulls will aim to push the XLM/USDT pair toward the overhead resistance at $0.52. A break and close above this level may indicate the start of another uptrend toward $0.64.
Conversely, if the price falls below the 20-day SMA, it would suggest that short-term bulls are taking profits, potentially driving the pair down to the 61.8% Fibonacci retracement level at $0.34.
Sui price prediction
Sui (SUI) declined from the $4.30 resistance on July 18, suggesting active selling at higher levels.
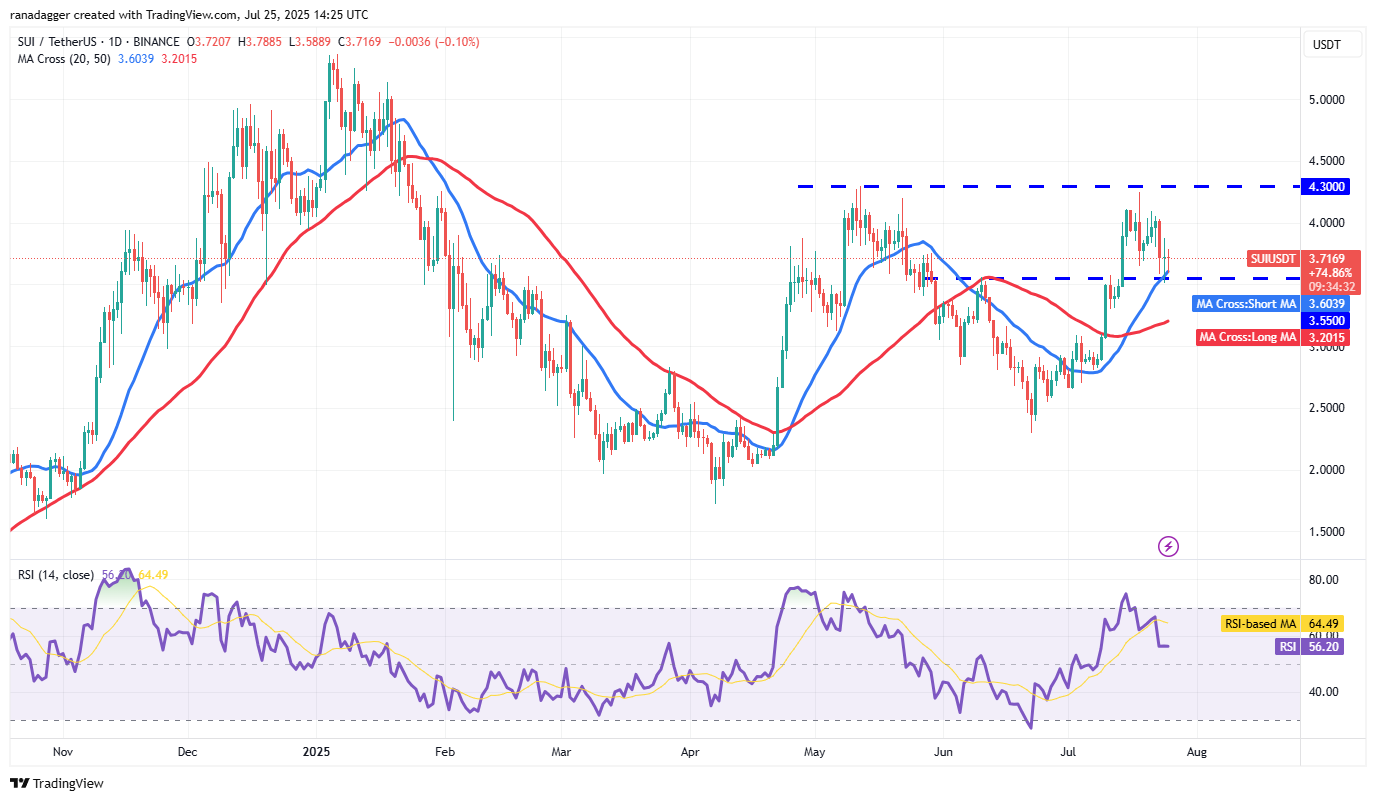
The critical support to watch in the near term is at $3.55. A rebound from the current level and a break above $3.87 may lead to a trading range forming between $3.55 and $4.30, with buyers gaining momentum beyond $4.30.
In contrast, if the price drops below $3.55, it signifies that bullish momentum has diminished, possibly leading the pair down to the 50-day SMA ($3.20), which could draw in buyers.
This article does not constitute investment advice or recommendations. Each investment and trading action carries risks, and readers should conduct their own research before making decisions.