Key points:
-
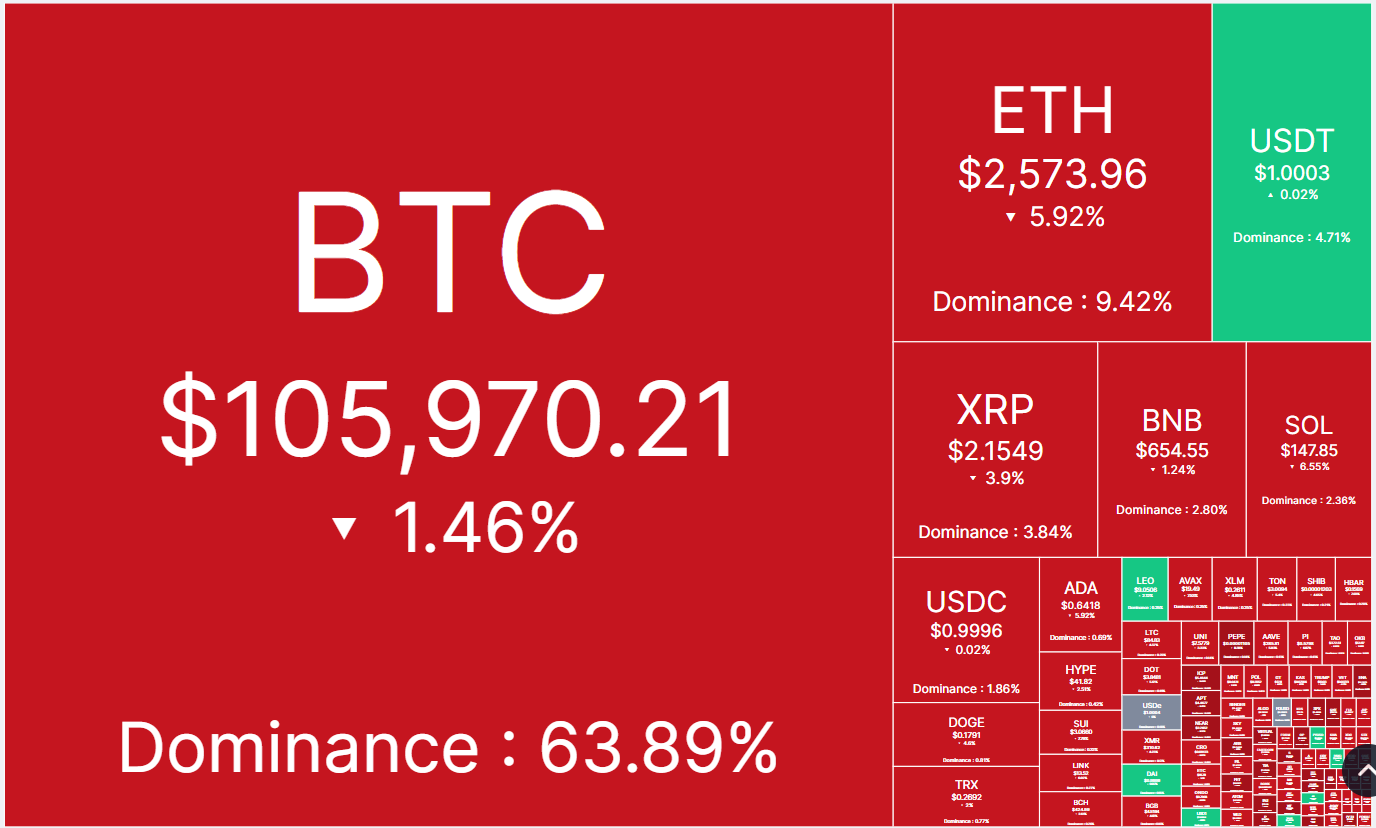
Bitcoin seeks support near $103,000, but increasing uncertainty in global markets may limit potential rallies.
-
Some altcoins are gaining interest at lower price points, indicating a willingness among traders to buy during dips.
Bitcoin (BTC) dipped below $103,000 following news of Israel’s airstrikes on Iran; however, the emergence of buyers at lower levels helped push the price back toward $106,000.
Material Indicators, a trading resource, noted in a post on X that Bitcoin’s price is unlikely to drop significantly lower, but a meaningful increase may not occur until after the next Fed meeting.
Support for this viewpoint came from a study by Andre Dragosch, head of research at ETC Group. The study indicated that Bitcoin typically recovers and often exceeds pre-event price levels within 50 days.
Conversely, John Bollinger, the creator of Bollinger Bands, expressed a different outlook. In a post on X, he mentioned that Bitcoin has completed three upward movements after forming a “W-shaped” double bottom near $75,000. During discussions, Bollinger noted that three pushes to a high might signify the end of the previous trend, which could lead to either a reversal or consolidation.
Will Bitcoin and certain altcoins recover their upward momentum? Let’s examine the charts of the top 10 cryptocurrencies to find out.
Bitcoin price prediction
On Friday, Bitcoin fell to the 50-day simple moving average ($103,159), where buyers are attempting to stop the decline.
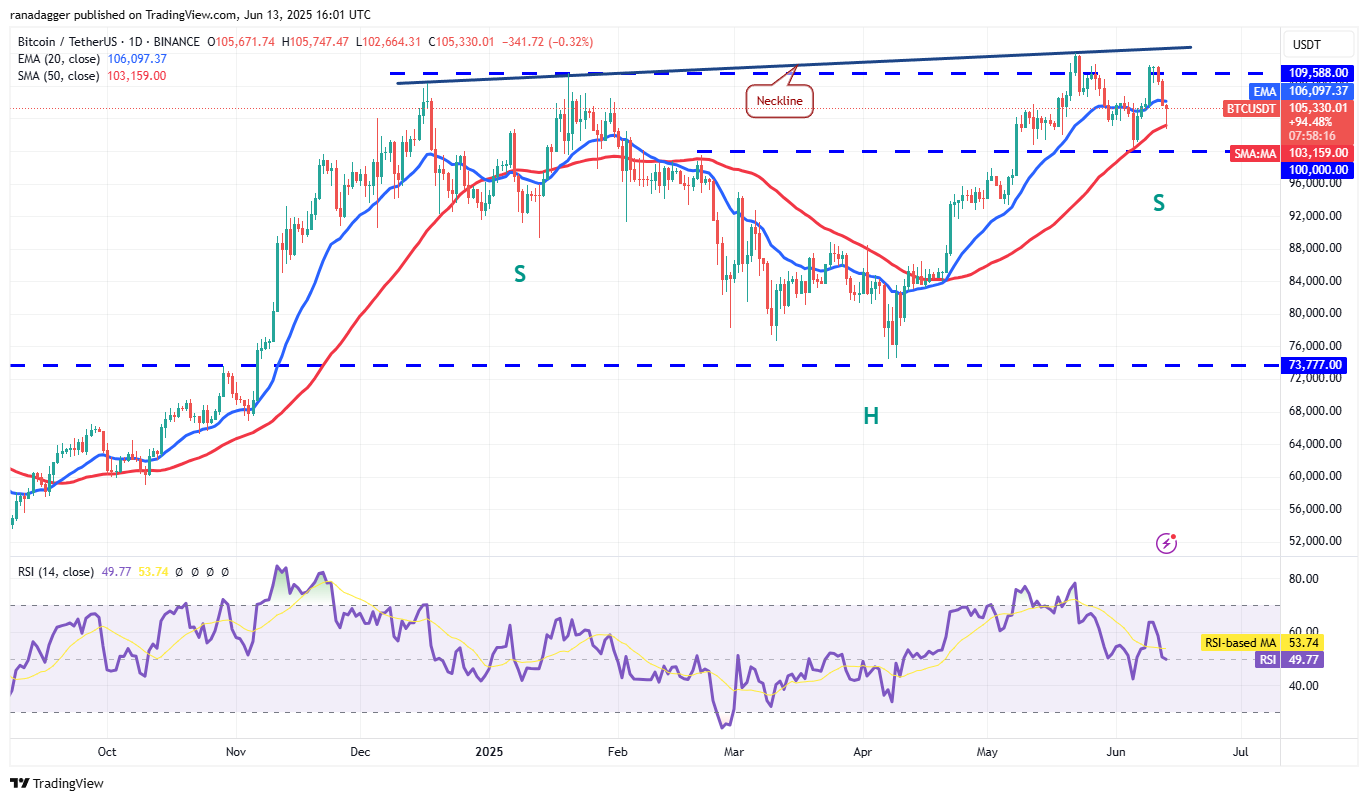
The 20-day exponential moving average ($106,097) is flattening, while the relative strength index (RSI) hovers around the midpoint, suggesting potential consolidation in the near future. Key levels to monitor are $100,000 on the downside and the all-time high of $111,980 on the upside.
If the $100,000 level falters, the BTC/USDT pair could decline to $92,000. Conversely, a break and close above $111,980 would indicate a resumption of the upward trend, potentially propelling the pair to $130,000.
Ether price prediction
Ether (ETH) declined from $2,879 on Wednesday and fell below the 20-day EMA ($2,580) on Friday, indicating that the market rejected the breakout above $2,738.
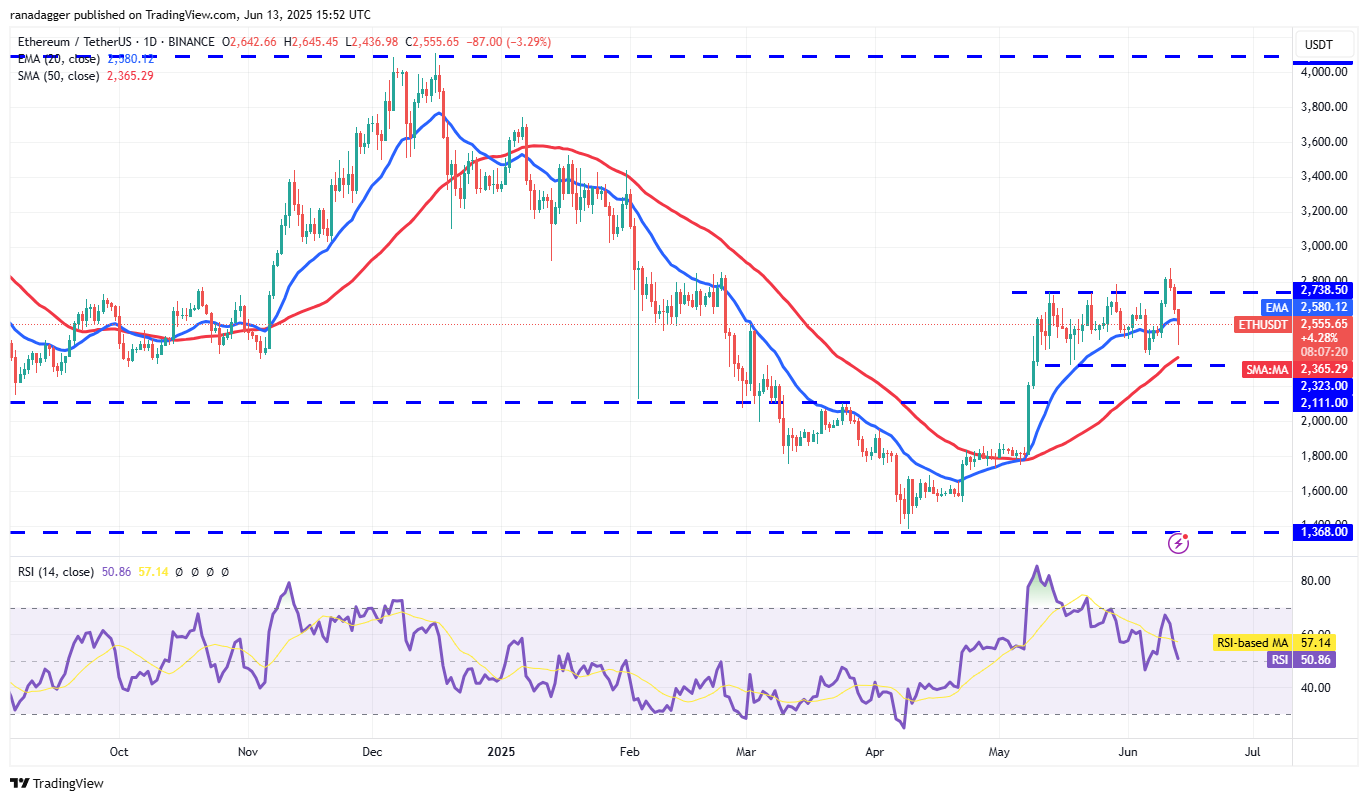
The 20-day EMA is leveling off, and the RSI has dropped to the midpoint, highlighting a balance between supply and demand. If the price recovers from the current level or $2,323, sellers will likely attempt to halt the relief rally in the $2,738 to $2,879 range. Should the price decline from this area, the ETH/USDT pair may consolidate further.
To initiate the next upward move toward $3,153, buyers must push the price above $2,879. On the downside, a breach below $2,323 could drop the pair to $2,111.
XRP price prediction
XRP (XRP) broke above the moving averages on Monday, but the bulls were unable to maintain the momentum.
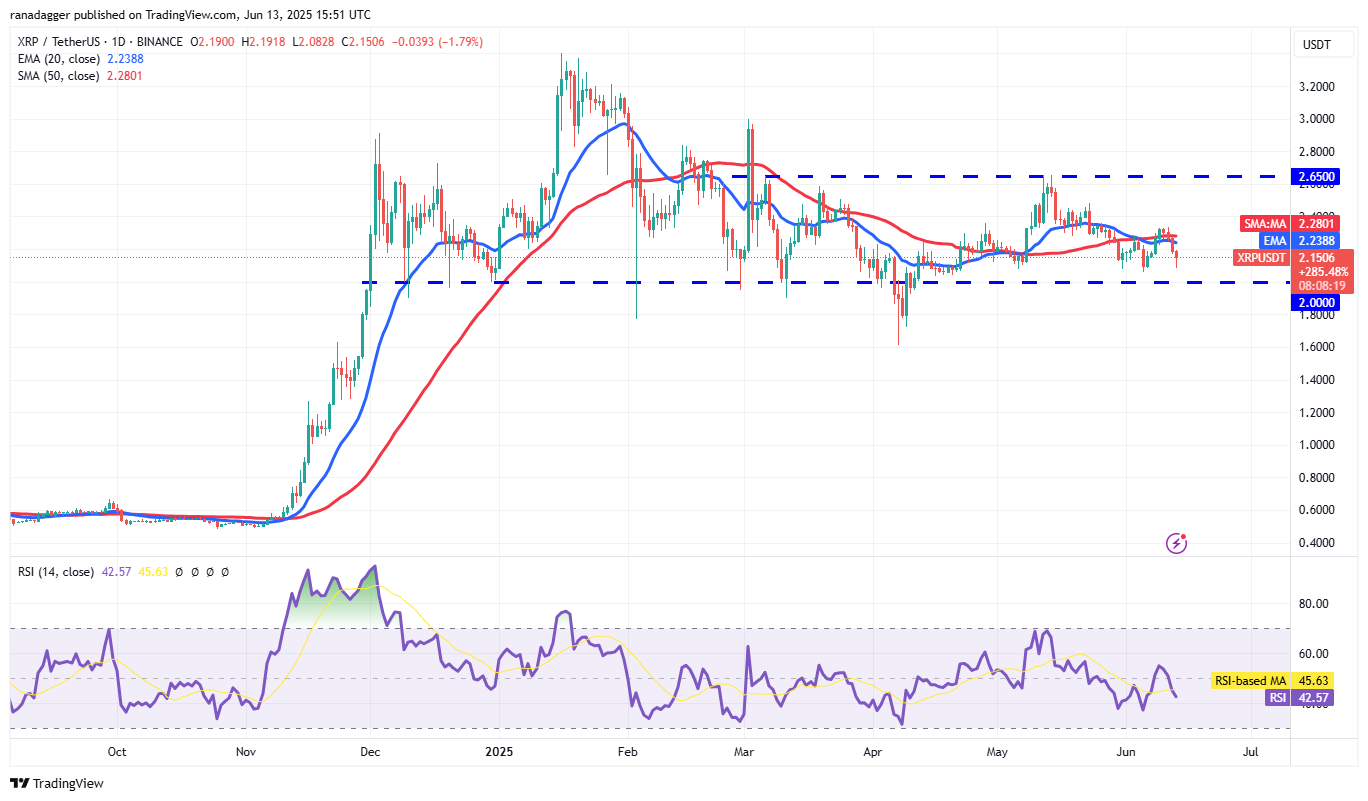
The price turned down on Wednesday and has approached solid support at $2. Buyers are expected to defend the $2 level vigorously, as a break and close below it could indicate the onset of a new downtrend. The XRP/USDT pair might then decline to $1.61, and possibly to $1.28 thereafter.
Alternatively, if the price rebounds sharply from $2 and breaks above the moving averages, it would suggest that the range-bound activity may continue for a while.
BNB price prediction
BNB (BNB) has been trading in a range between $693 and $634 for several days, showing a balance between supply and demand.
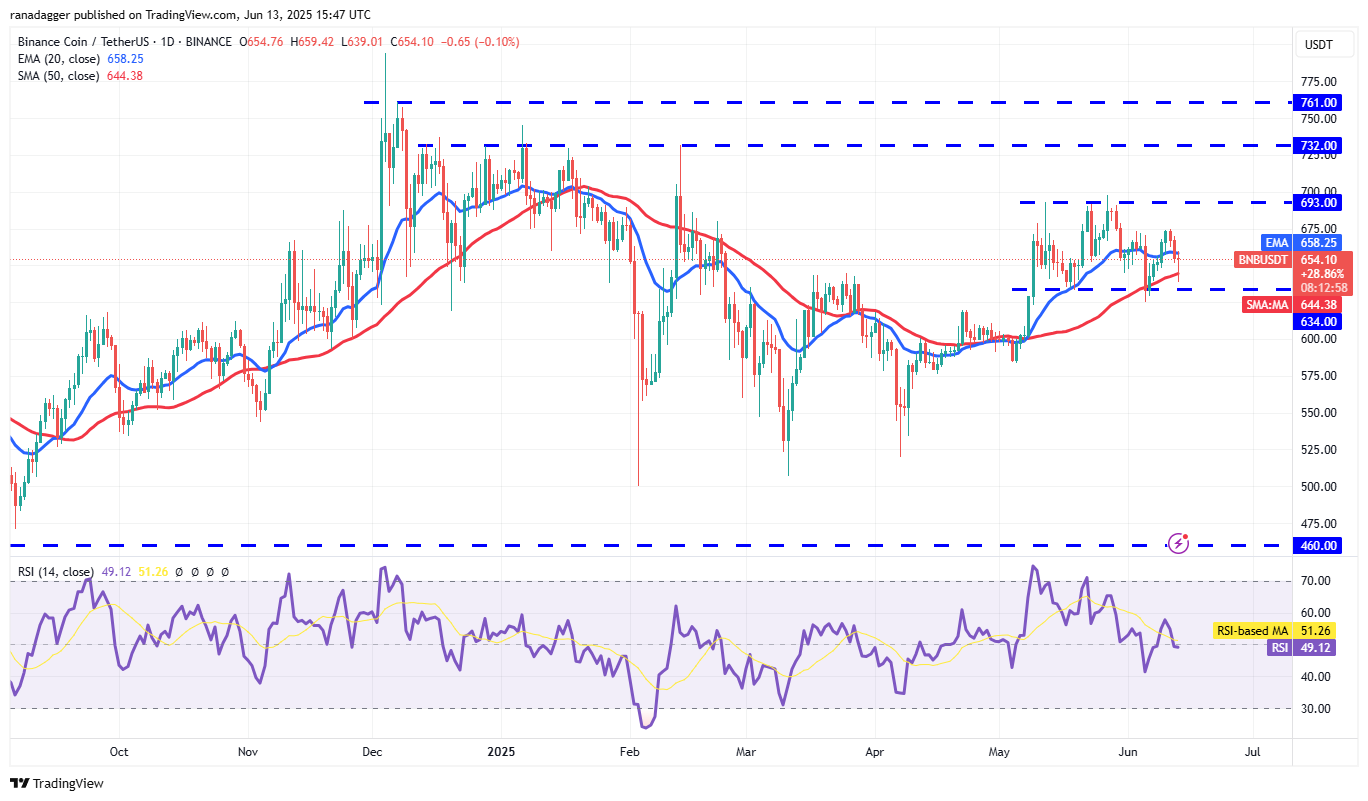
The flat 20-day EMA ($658) and RSI near the midpoint do not provide a clear advantage to either bulls or bears. If the price starts to rise from $634 and surpasses the 20-day EMA, the BNB/USDT pair could remain within the range for longer.
Conversely, a break and close below $634 would suggest bearish control, likely intensifying selling and pulling the pair down to $600. Buyers are expected to defend the $580 to $600 support zone aggressively.
Solana price prediction
Solana (SOL) climbed above the moving averages on Monday but could not hold onto the higher levels.
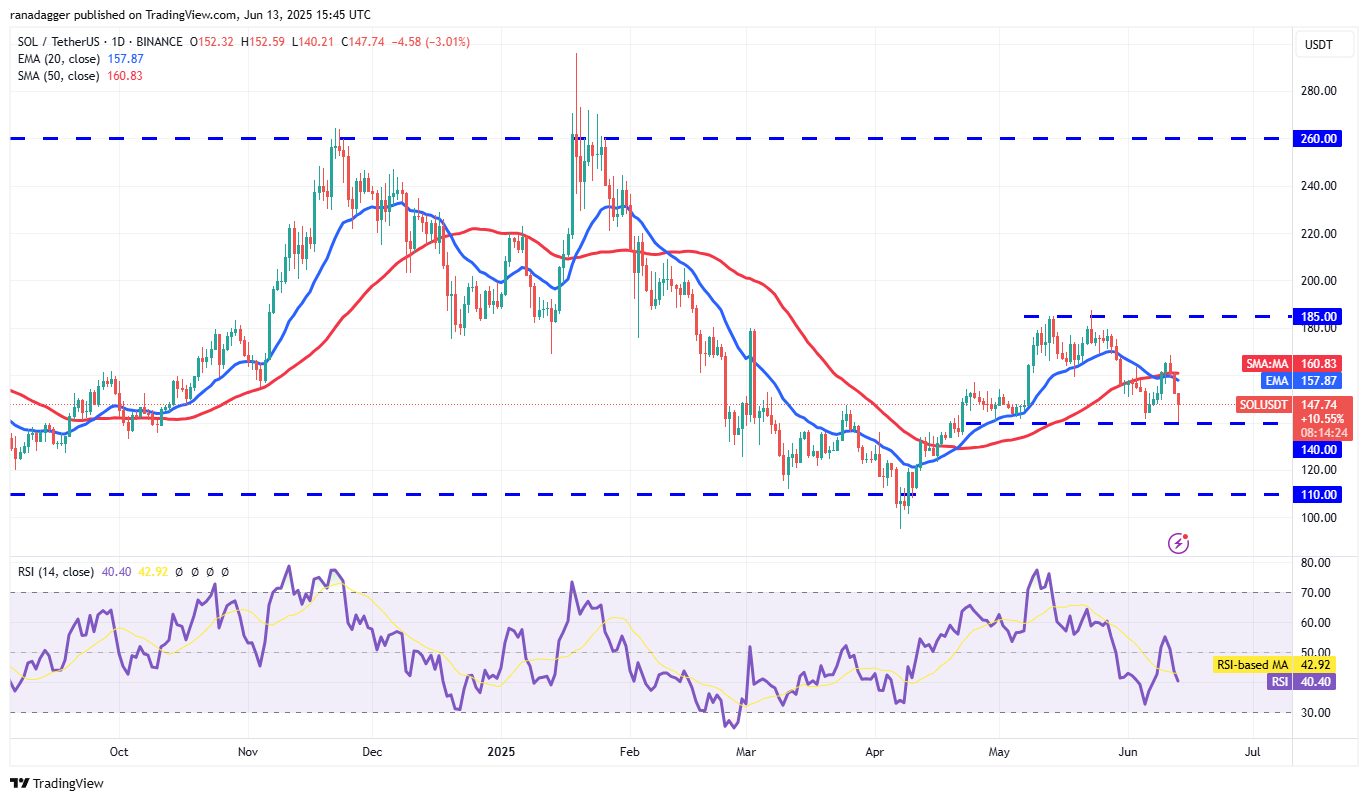
The price fell from $168 on Wednesday and broke below the moving averages on June 12. The SOL/USDT pair has tested the $140 support, which is crucial for bulls to defend.
If the price rebounds from the $140 support, the bulls will attempt to push the price above the moving averages again. Conversely, if it breaks and closes below $140, the pair may drop to $123 and eventually $110.
Dogecoin price prediction
Dogecoin (DOGE) declined from the $0.21 level on Wednesday, suggesting that the price remains within the lower half of the $0.26 to $0.14 range.
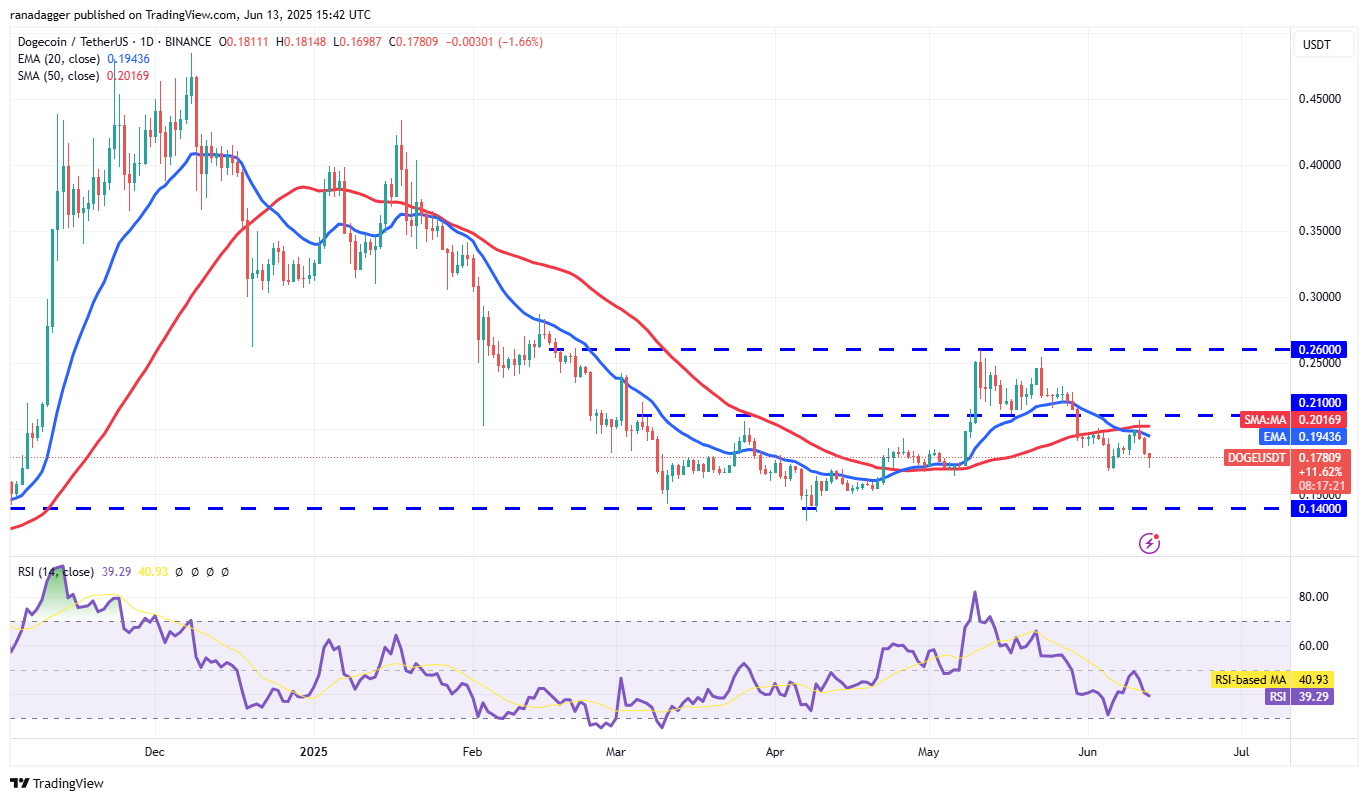
While there is support at $0.16, it is likely to be tested. The DOGE/USDT pair could fall to the $0.14 support, where buyers are anticipated to step in. A strong bounce from the $0.14 level may prolong the range-bound movement.
The next significant move is likely to occur on a breach above $0.26 or below $0.14. If the $0.14 support fails, the pair could drop to $0.10. Conversely, if it breaks above $0.26, the pair could rise to $0.38.
Cardano price prediction
Cardano (ADA) fell from the 50-day SMA ($0.72) on Wednesday, indicating that sellers are continuing to act on rallies.
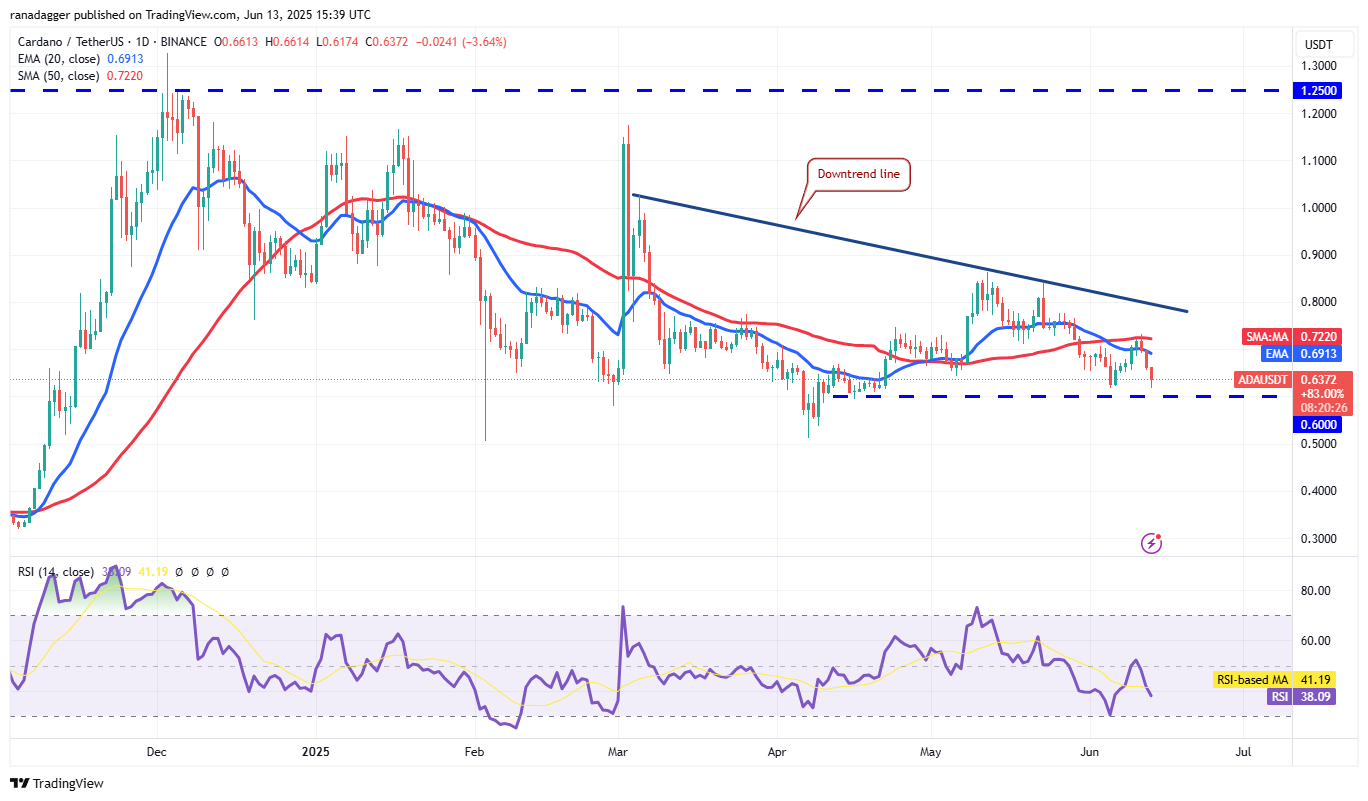
The downward-sloping 20-day EMA ($0.69) and the RSI in negative territory indicate a bearish edge. If the price breaks below $0.60, the ADA/USDT pair could plunge to solid support at $0.50, which buyers are expected to defend vigorously.
The first sign of strength would be a break and close above the 50-day SMA, which could lead to a rise toward the downtrend line—a critical level to monitor. A close above this line would suggest a potential trend change.
Related: Here’s what happened in crypto today
Hyperliquid price prediction
Buyers drove Hyperliquid (HYPE) above the $42.25 resistance on Wednesday and Thursday, but were unable to maintain those higher levels.
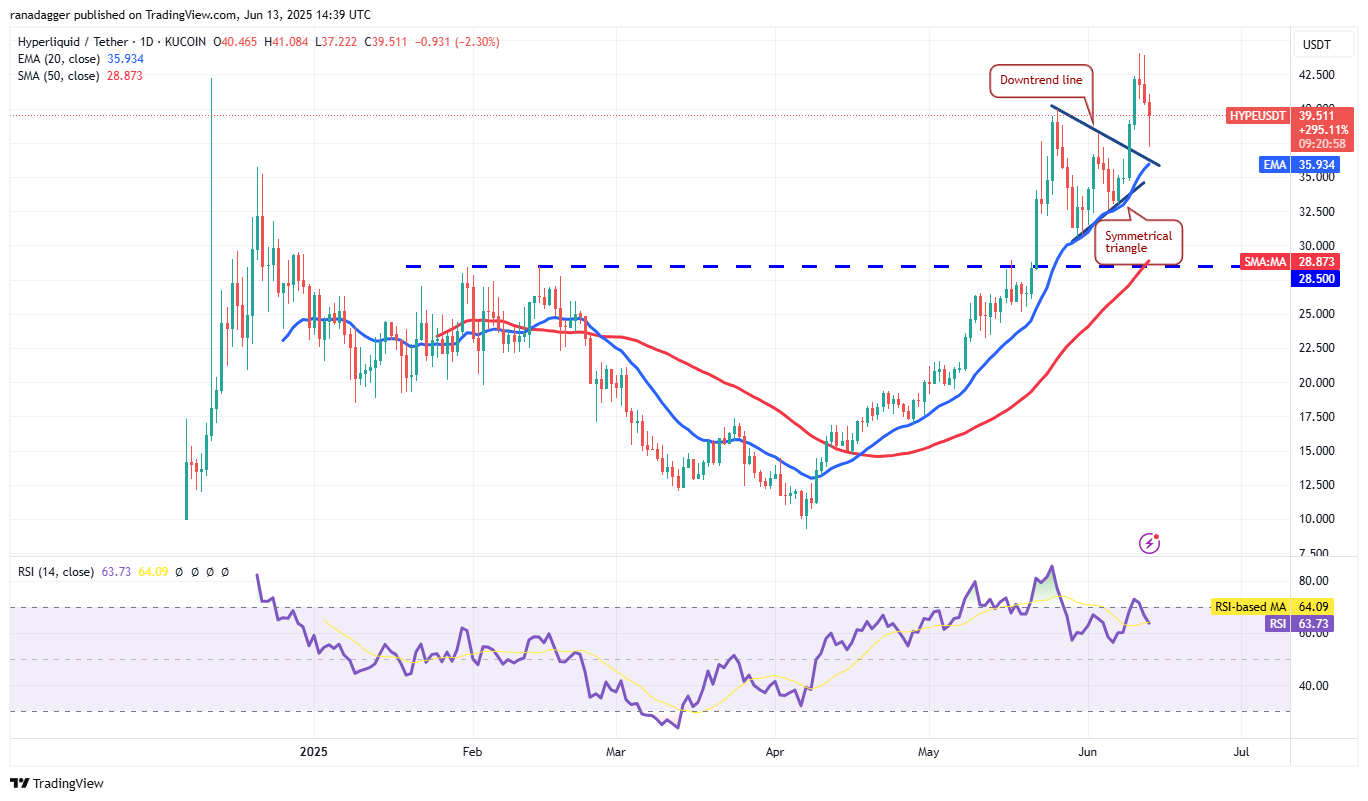
This may have prompted short-term buyers to take profits, pulling the price back toward the breakout level from the symmetrical triangle pattern. The upward-trending 20-day EMA ($35.93) indicates a buyer advantage, but the developing negative divergence on the RSI suggests that bullish momentum is waning. Buyers will need to push the price above $44 to revive the uptrend toward $50.
On the downside, if the price breaks and closes below the 20-day EMA, it could accelerate selling and pull the pair down to $30.50.
Sui price prediction
Sui (SUI) declined from the 50-day SMA ($3.55) on Wednesday, indicating that sellers are effectively defending that level.
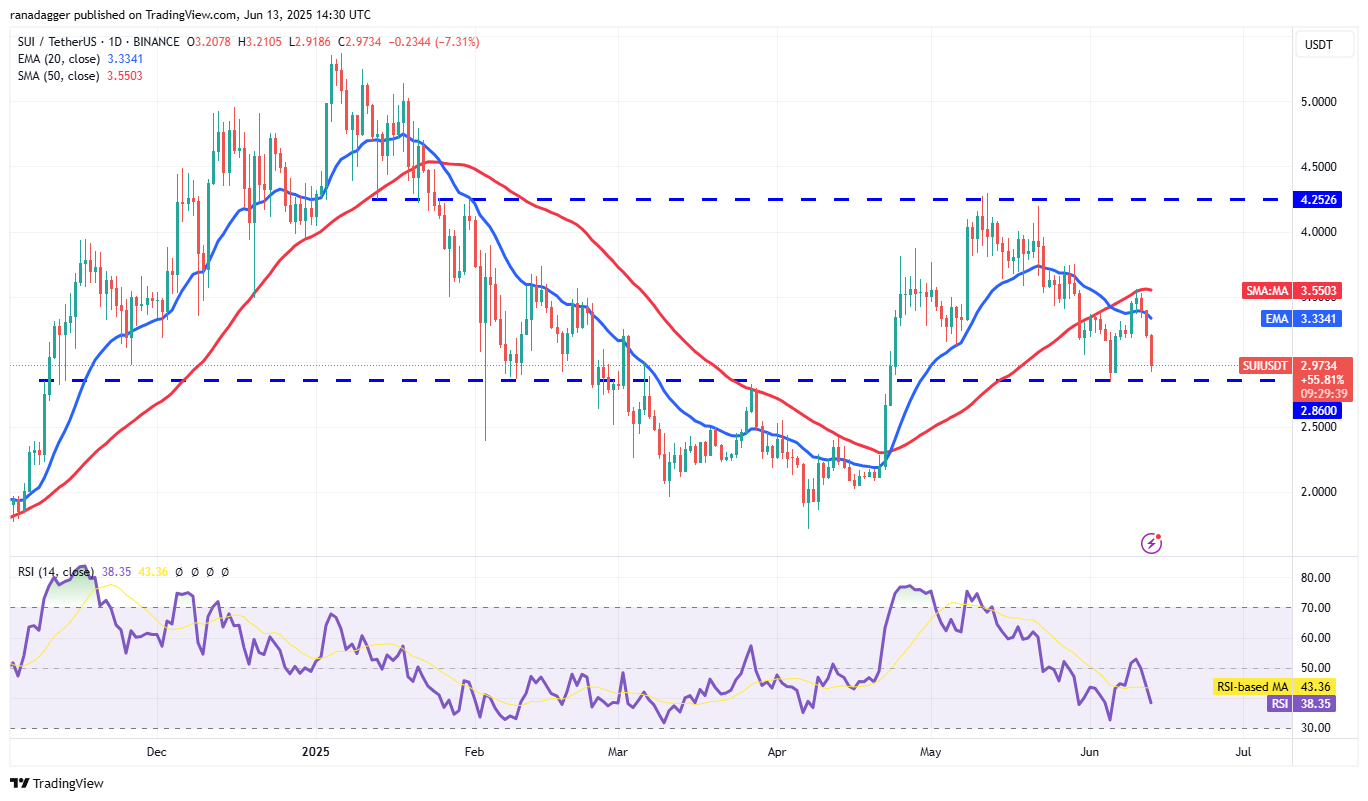
The SUI/USDT pair has reached notable support at $2.86, an important level to observe. Sellers will attempt to push the price below this mark; if successful, the pair could drop to $2.50.
However, buyers are likely to defend the $2.86 level. A rebound from this support could set the stage for a move toward the moving averages. If the price sharply declines from the moving averages, the risk of breaking below $2.86 increases. Buyers must drive the pair above the moving averages to pave the way toward the $4.25 resistance.
Chainlink price prediction
Chainlink (LINK) retraced and re-entered the descending channel on Thursday, suggesting active selling at higher levels.
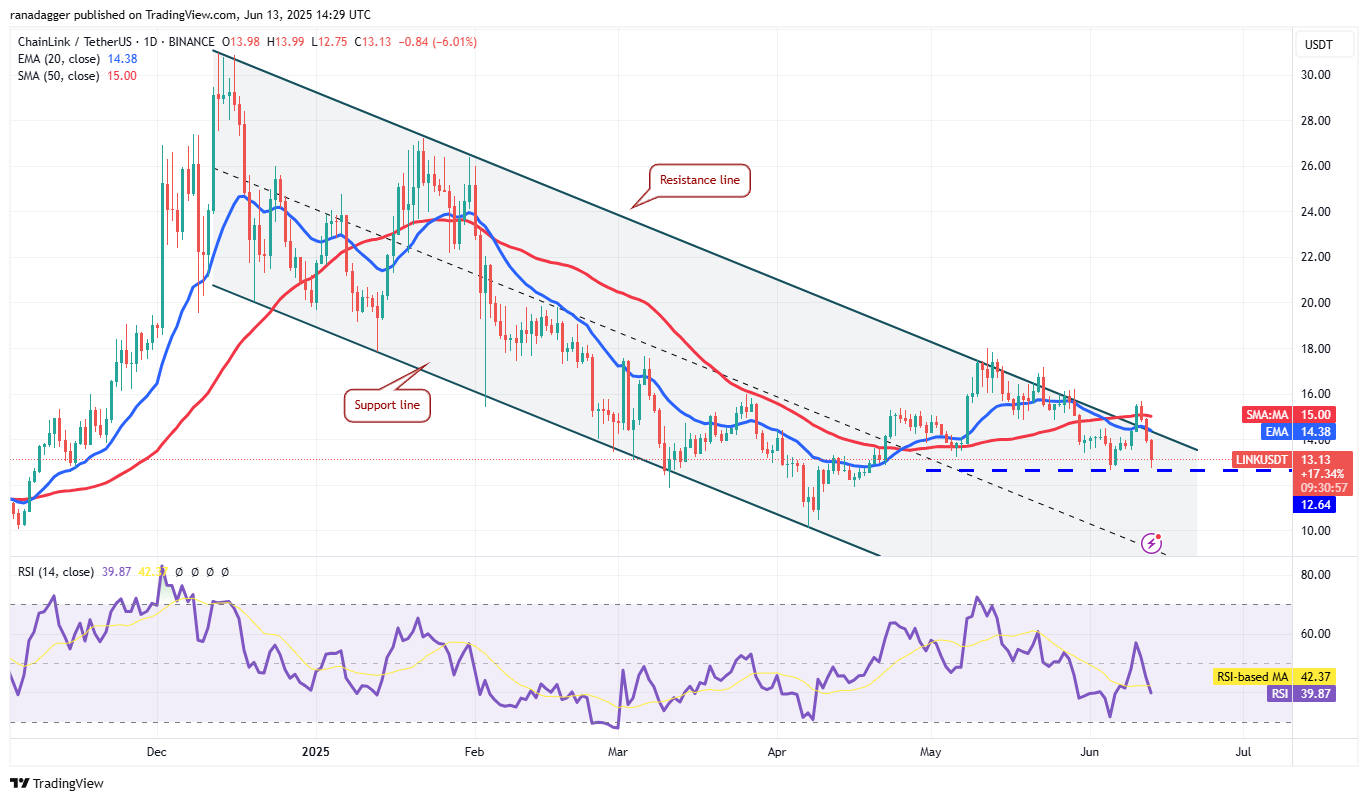
The bears are attempting to push the price below the $12.64 support. If successful, the LINK/USDT pair may decline to $10, prolonging the pair’s stay within the channel for further days.
To prevent further decline, buyers must promptly move the price above the $16 mark, which indicates strong buying pressure at lower levels. This could lead the pair higher to $18 and possibly to $20, signaling a potential trend shift.
This article does not contain investment advice or recommendations. Every investment and trading move involves risk, and readers should conduct their own research when making a decision.